

When you read this, I’ll probably be 36,000 feet up on the way to our 2026 MoneyShow Masters Symposium San Francisco. I’ll have a LOT of charts to share when I’m in town, but here’s a sneak peek at one – which proves gold is getting its mojo back!
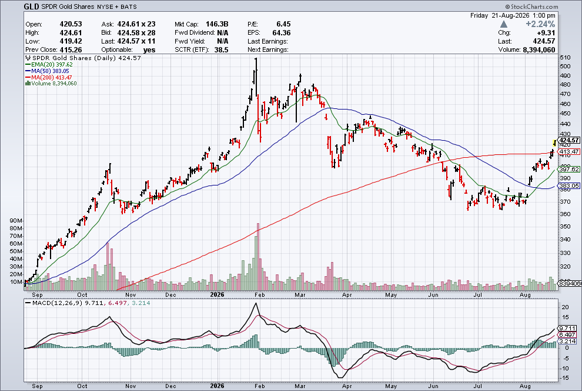
The MoneyShow Chart of the Day shows the SPDR Gold Shares (GLD) going back one year. I’ve included the 20-day, 50-day, and 200-day exponential moving averages, as well as volume and MACD at the bottom.
SPDR Gold Shares (GLD)
Source: StockCharts.com
You can see how gold spent several months in “purgatory” after the big run in 2025 and the blow off top in January. Back then, I said the move was likely NOT the end of the bull market. Instead, I said it would be followed by a long period of digestion.
That’s what we’ve seen – and it’s being followed by an upside breakout. Recapturing key moving averages on an uptick in volume bodes well for the longer term, too.
What’s driving the renewed interest in gold? Not to mention cryptocurrencies? The “Bessent Vs. the Bond Market” battle. It’s weakening the dollar and encouraging investors to seek out traditional and new stores of value. Additional measures aimed at artificially suppressing yields at a time of exploding government debt should only pour more gasoline on the fire.
So, yes, I am STILL a bull on precious metals. And the technicals suggest that's the right stance.