
Did you see last week’s announcement about your new “Chart of the Week” feature? If not, you can check it out here.
With that out of the way, I’m focusing on crude oil this week. Check out this daily chart showing the trading activity in West Texas Intermediate oil futures going back to last summer. I’ve added RSI as an indicator, and the 50-day and 200-day simple moving averages.
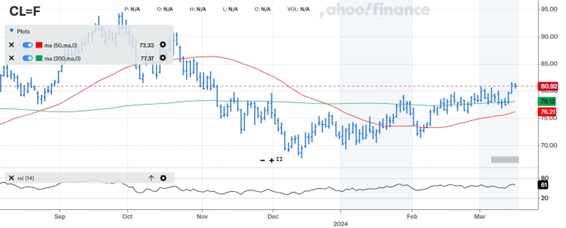
Source: Yahoo Finance
Crude had a huge run into the early-2022 highs – after trading in NEGATIVE territory during the depths of the Covid pandemic. Then it entered a long period of sideways chop. But after briefly slipping below $70 in late 2023 on concerns over both supply AND demand, WTI has firmed up nicely.
Now, it’s poking its head above $80. The 50-day has acted as support on pullbacks, and buying interest has been steady. That could open the door for a move back to $90 in the months ahead.
While that wouldn’t be welcome news for Jay Powell and his Federal Reserve friends, it would help push things like the Energy Select Sector SPDR Fund (XLE) up the performance tables after a rough start to 2024. The benchmark energy stock ETF is now up 6% year-to-date. The United States Oil Fund (USO), for its part, is now showing YTD gains of more than 9%.


