
As the current bull market just celebrated its five-year anniversary, Lance Roberts of PhilStockWorld examines five market internals to see what they portend for it.
Having two opposing sets of opinions is what makes a market in the first place, but the current difference of opinion makes this a good opportunity to take a look at the health of the current market rally. We are currently at 100% of target allocations. The mistake that many individuals make is assuming that if I express concern about particular aspects of the market that means I am "bearish" and must be "all in cash." In fact, expressing a "bearish view" in the current market environment almost rises to the level of heresy (thank goodness that "burning at the stake" has been outlawed, at least for now.) However, if you want the "bullish view" just turn on the television, pick up any financial editorial or scroll the internet; finding an unbiased non-bullish discussion is about as rare as a Yeti sighting these days.
In my view, the real risk is adopting a viewpoint that is inherently "bullish" or "bearish." This is a trap that investors fall into that leads to "confirmation bias" where opposing opinions are disregarded. For investors, this is ultimately fatal. For me, the markets are either "rising" or "falling." The financial media primarily exists as a coincident indicator only telling me what I already know. What I need to know is what may cause the current "trend" to change. More importantly, when is the current "risk" I am taking with my client's money outweighed by the potential "reward."
With portfolios currently fully exposed to the market, the "risk of loss" has been elevated. Therefore, like a doctor/patient relationship, we can monitor several internal indicators of the markets health in order to gauge the when the "risk" exceeds the potential for "reward."
Net New Highs
The first internal measure I want to examine is the number of NET new highs. This is the number of stocks hitting new highs less the one hitting new lows. In an "exuberant" bull market, you would expect to see the number of net new highs at very high levels.
NYSE New Highs/lows Chart
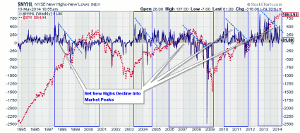
Click to Enlarge
What the chart above tells us currently is that the number of net new highs is declining. This is typical as markets become exhausted during a bullish phase. Unfortunately, net new highs are only useful in indicating a potential correction, but not when that correction turns into a more meaningful reversion. Therefore, declining net new highs, as markets are rising, should be treated with equal caution.
Advancing Versus Declining Issues (Market Breadth)
Another measure of the internal health of the market is its "pulse." One way to look at this is the "breadth" of advancing versus declining issues.
NYSE Advance/Decline Ratio Chart
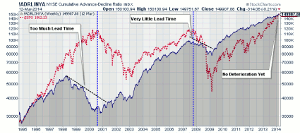
Click to Enlarge
When the breadth of the market is advancing, as it is now, the markets are within a bullish trend meaning that investors should be exposed to risk. The problem with market breadth is that it is historically not a very precise market timing indicator and, like net new highs above, doesn't distinguish between short-term corrections and full-blown reversions. Therefore, declines in market breadth should not be ignored and evaluated within the context of the overall trend of the market.
NEXT PAGE: What 3 More Market Internals Say
|pagebreak|Number of Stocks Above Their 200-Day Moving Average
In a rising bull market, the number of S&P 500 (SPX) (SPY) stocks above their 200-day moving average (dma) would be expected to be high. The longer the bull market has run, the higher the number of stocks above their individual long-term moving averages will be. Deterioration in the number of stocks above their 200 dma is a warning that a potential correction is in the making.
SPX Stocks Above 200 Day MA Chart
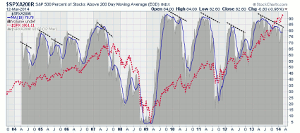
Click to Enlarge
The chart above shows historically when the percent of stocks above the 200 dma have peaked, and began a decline, market corrections have quickly followed. The problem with this indicator, as with the other measures discussed herein, is the inability to determine when a correction becomes a "mean reverting" event.
Number of Stocks on Bullish "Buy" Signals
Another measure of market health is the number of stocks on bullish buy signals as determined by point-and-figure analysis. Again, the longer a bull market has been in process, the higher the number of stocks on bullish buy signals there should be. Historically, as shown in the chart below, when this indicator has turned lower corrections were generally soon to follow.
SPX Bullish % Chart
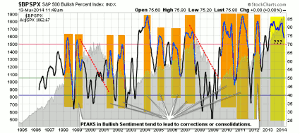
Click to Enlarge
The current period is the longest since 2004 where the bullish percent index has peaked and turned lower without a significant correction. The deterioration in the index certainly suggests a much higher risk profile in the market as the bullish strength weakens.
Long Term Moving Average Convergence/Divergence
As I discussed recently, all of these indicators are "warning signs" that there is potential danger ahead. That danger could range from a mild correction of 5-15% or something much more mean reverting in nature, which could easily approach 30% or more.
What these indicators don't tell us is when the current trend is changing from positive to negative. As Bill Clinton once stated "What is…is." In the world of investing there really is no "bullish" or "bearish" view, it is simply what "is" until "it isn't."
SPX Chart With MACD
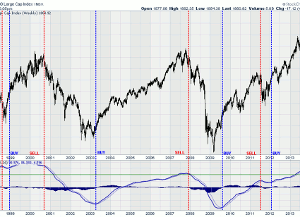
Click to Enlarge
The chart above shows the market as compared to a long-term moving average convergence/divergence (MACD) indicator. What this indicator clearly shows is when the "price trend" has turned from positive to negative and back again.
The current bullish trend remains intact, which suggests that portfolios remain fully allocated at the current time. However, the ongoing deterioration of the "market internals" also suggest "attention" be paid to portfolios. The "easy money" is long behind us and we are only "marking time" until the next correction or major market reversion.
While the Federal Reserve may have inflated asset prices through continued rounds of liquidity, they have not repealed either economic or market cycles. The sustained levels of investor complacency, a complete disregard of investment risk and fundamentals, and the continued stretch for yield is a toxic brew that has always ended badly. This time will be no different.
That last paragraph is not a "bearish" viewpoint; it is just a fact of what currently "is." As a portfolio manager, I must remain invested in the markets when the trend is positive or suffer "career risk." That is also a fact. However, understanding when the light at the end of the tunnel is, in fact, an oncoming train is what defines the "long game" of investing.
By Lance Roberts of PhilStockWorld


