Richard Cox of TradersLaboratory highlights the uses and benefits of lagging and leading indicators, specifically in regards to technical analysis charting.
When we look at the available charting tools that are available in the commonly used trading stations, a variety of different options can be seen. Specifically, these tools will often be divided into what we will call lagging indicators and leading indicators, and the fact that there are different types of trading tools goes far to dispel some of the misconceptions that are commonly held with respect to technical chart analysis. Here, we will look at some of the differences that can be found in these two types of indicators so that traders have a better understanding of the functions in many of the commonly used trading applications.
Know Your Indicators
It's important to understand the strengths and weaknesses of any indicator before using it in any real money trade. One of the most common mistakes new traders make is to start placing indicators on their charts without having a real understanding of the calculations behind the indicator or the way it is best used in analysis. Some might say that a full understanding of these indicators is unnecessary: Buy if prices fall into oversold territory, or Sell if prices reach overbought territory.
Unfortunately, trading is not this simple. If technical analysis was this easy, everyone could be a profitable trader. Even further, we could simply set software applications to find these signals and walk away as billionaires. The reality is that trading takes more work than this and we will need to do a good deal of homework before we can make our indicators work for us in consistent and repeatable ways. Not knowing the (usually simple) formulas behind your indicators is not an acceptable practice—and it will negatively influence your trading results. Without this, it will be much more difficult to understand the true application behind each type of indicator.
But before you delve into the specifics of your chosen indicator, you must first understand the types of indicators that are available. The two mains types of indicators are leading and lagging indicators. Lagging indicators alert traders to situations that trends have started and that it is time to pay attention to developments that have already become apparent. Leading indicators aim to signal trend changes before they develop. This might seem to suggest that leading indicators will lead to instant riches but the fact is that the signals generated are not always accurate. Traders using leading indicators will, in many cases, encounter head fakes and erroneous breakouts. Trades taken on these inaccurate signals eat into the advantages created by the leading nature of these indicators. But this does not mean that they cannot be used to generate consistently profitable signals over the longer-term.
Oscillators: Leading Indicators
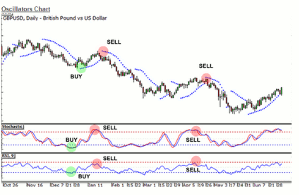
When using common trading platforms, one of the main indicator options is the Oscillator. Oscillators are objects that mark two points and move back and forth between those points (always falling inside those points). When the oscillator reaches an extreme area within this 2-point range, buy and sell signals are generated. When seen near the midpoint of this range, the signal is neutral and no trade should be taken. Common examples of indicators include the Relative Strength Index (RSI), Stochastics, Williams %R or Parabolic SAR. All these indicators help traders identify reversal spaces, as the prior trend reaches completion and prices are preparing to make a forceful move in the opposite direction. In the first chart, we can see examples of buy and sell signals for all three indicators.
NEXT PAGE: Momentum, Plus Buy and Sell Signals
|pagebreak|As we can see from the first chart, price activity causes all three oscillators to move back and forth between buy and sell signals, creating opportunities in both directions. This chart, of course, represents an ideal example, where all indicators are in agreement with one another. For example, the RSI might show a screaming buy while the Parabolic SAR is showing a sell signal. In these cases, it is better to simply step aside and stay out of the market. Additionally, this is a good reason why traders should not use too many indicators on their charts as this will greatly reduce the number of viable signals that become present during your daily routines.
Another point to remember is that all leading calculators do not use the same calculations and formulas. The RSI bases its signals on the changing levels in succeeding closing prices. Stochastics uses the highs and lows of price ranges over the time frame shown on your chart, relying much less on successive time periods. Parabolic SAR is has probably the most unique calculations of the bunch, and this can complicate trading signals when combined with other indicators. From this, it should be clear that not all leading indicators are created equal, and traders should practice with a few options before committing to any one choice.
Momentum Indicators: Lagging Indicators
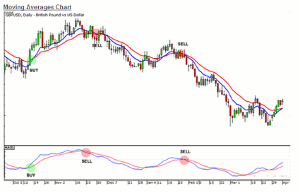
The second major category is the lagging indicator, which includes tools like Exponential Moving Averages and the MAC-D indicator. These tools are commonly used to spot trends that are starting or are already in place. The downside to using these indicators is that—since the trend is already in place—your entry signals will come later. This means less profit as a smaller portion of the overall move is captured. The upside to lagging indicators is that they send fewer false signals, which will generally mean that you are stopped out for a loss on fewer occasions.
In the second chart example, moving average crossovers are seen in conjunction with buy and sell signals sent by the MAC-D indicator. In all of these cases, the indicators were sent signals (using their accompanying formulas) and then the indicators themselves produces signals shortly afterwards. Here, traders using these signals would have missed some portion of the initial move but the validity of the signals sent would have had a better chance of eventual success.
Conclusion: Learn about Your Indicators and Play from Their Strengths
Traders have different types of indicators at their disposal, and this is helpful when looking for tools that fit your individual trading style. Leading indicators can send trading signals before new trends or reversals develop. Lagging indicators use available market information to send trading signals that have a slightly higher chance of being accurate (avoiding false breakouts but missing a portion of the early move). It is up to you to decide which approach best matches your risk tolerance and trading approach. It is possible that some tools will work better in some environments than it will in others, and this is an added reason why traders should practice their routines with a variety of indicators before committing real money to positions.
By Richard Cox of TradersLaboratory


