After 30+ years in the financial markets, MoneyShow's Tom Aspray has learned a thing or two about how to stack the odds in your favor and he shares them to help you achieve a profitable year.
Even though the stock market has continued in its upward path in early 2014, some of the market bulls are already becoming a bit nervous about the market. If this trend continues, it will eventually be a positive for stocks as bearish sentiment is still way too high. In a survey of 14 Wall Street strategists, the average target is 1955 for the S&P 500 in 2014.
That is quite a difference from last year when the analysts' average S&P 500 target was 1531 or a gain of 7.3%. The actual close at 1805 was 17.9% above the average target. Unlike 2013, no one is now looking for a lower close, while in 2013 two analysts were looking for the market to be unchanged or lower for the year. This year there are a number of targets above 2000.
It should be noted that making long-range forecasts is difficult but investors, in my opinion, should be cautious about following a big firm's recommendations. A review of the most- and least-favored stocks for 2013 revealed that the least-favored stocks did almost three times better than those most-favored stocks.
So what is an investor to do in 2014? Here are my recommendations for investing success this year.
The recommendations do vary depending on what type of investor you are, and I have defined three categories below. I will give specific recommendations for each category but first I would like to summarize my outlook for the key markets.
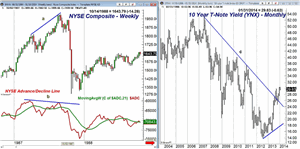
Since late 2013, some market bears have been warning of a stock market crash such as what occurred in1987. The weekly chart of the NYSE Composite covers the period from 1986 through 1988. The Composite made sharply higher highs through the summer of 1987, line a. One of my key market indicators, the weekly NYSE Advance/Decline peaked in March and then formed a significantly lower high in August, line b. This is the type of negative divergence that generally forms before a major drop.
That was the case in 2007 as similar divergences were evident at the October 2007 highs (see chart). The recent new high in the weekly A/D line indicates that another market crash is unlikely though sharp corrections are possible. The strength of the A/D line keeps both the intermediate- and long-term outlook for stocks positive.
The US is still favored for stock investors, but for either the passive or aggressive investors, I would also commit 10-20% overseas. The sentiment and technicals on the emerging markets is still negative but I still think they could still be a contrary play for active investors in 2014.
The monthly chart of the 10-year T-note yield shows that the monthly downtrend, line c, was broken in August. As noted in May's column, the completion of the reverse head-and-shoulders bottom formation in T-note yields did signal higher yields. I expect yields to move even higher in 2014 and continue to recommend shortening the maturity of bond portfolios. The yield on the 10-year T-note could reach the 3.5-4% area.
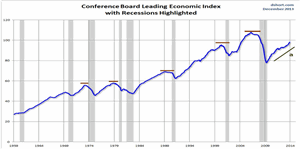
Since the fall of 2010, there have been suggestions that the US economy would slip back into a recession. In many instances, like after the debt ceiling crisis, this negative sentiment led to good buying opportunities in the stock market. I have been resolute in looking for an improving economy and the leading indicators from the Conference Board is one of may favorite economic barometers.
This long-term chart shows that it has a good record of warning of recessions in advance. As noted on the chart, the LEI will typically flatten out and then turn lower before a recession. The LEI is currently in a strong uptrend, line a, and would likely take all of 2014 before it could flatten out and turn lower. I do expect to get a number of disappointing economic reports in 2014 like last Friday's job report but don't let one data point alter your plan.
Most gold investors have given up after the plunge in gold prices in 2013. The drop in gold prices caused a $16.6 billion dollar loss for the Swiss National Bank who announced they will not be able to make additional payments to their 26 regional governments. Sentiment can still get even more negative but prices are trying to stabilize. Therefore, active investors should consider a small commitment (3-5%) to the gold miners. If a bottom is confirmed, I will have additional recommendations for active investors.
NEXT PAGE: What to Watch
|pagebreak|
Here is what I would recommend.
The New Investor: I would concentrate on investing with a broker that offers low-cost ETFs and charges no commission to invest in them. Most of the major firms do offer such funds.
Then you need to need to assess your risk level in order to determine what percentage you want to invest in the stock market. Once that is determined, I would recommend a dollar cost averaging approach as I did in It's Never Too Late to Build a Portfolio last August for those who were not yet invested.
I would recommend that 80% of your stock investments be concentrated in an S&P 500-tracking ETF. I would divide the amount into five equal amounts and invest the first once the S&P 500 drops at least 2% from its high. The remaining four investments should then be made every two weeks over the next two months.
I would use the same approach to invest 20% in low-cost global stock ETF like the Vanguard Total World Stock ETF (VT). It has a very low expense ratio of 0.18% and currently yields 2.07%.
The Average Investor: This is the investor who has been in the stock market for a good part of the past several years and is currently invested in stocks. This investor should be willing to monitor their portfolio at least once a month and consider rebalancing it every quarter.
This type of investor also needs to determine their risk tolerance level. This could range from fully invested to 50% stocks and 50% in a medium-term bond fund like the Pimco 0-5 Year high Yield Corporate Bond ETF (HYS), which has an expense ratio of 0.55% and a current yield of 4.34%. Also check to see if your brokerage firm offers a no-commission alternative to this fund.
The Active Investor: This is the type of investor that my daily Charts in Play column is designed for and assumes they are willing to check their portfolio at least once a week.
A core position of 10-20% in a low cost S&P-tracking ETF is suggested with another 10% to invest in the market-tracking ETFs that shows the best relative performance. This is currently the PowerShares QQQ Trust (QQQ).
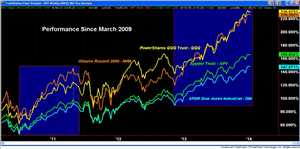
The chart above shows the % performance of these four ETFs; the Spyder Trust (SPY), SPDR Dow Industrials (DIA), PowerShares QQQ Trust (QQQ), and the iShares Russell 2000 Index (IWM) since the 2009 lows.
I have highlighted two periods (in blue) where one ETF outperformed the others. From July 2010 through April 2011, the small-cap IWM did about 12% better than the large-cap DIA. Also from the December 2012 lows until early 2014, both the QQQ and IWM have done much better than the SPY and DIA.
It also should be noted that during the market corrections in the past three years both IWM and QQQ have declined more sharply, which made holding on to them more difficult.
The remainder of your investment fund should be in money market funds in order to follow my recommendations in stocks and sector ETFs.
There are three important parts of the active investor strategy. I use a variety of methods to gauge the current market risk for new investments, and though I often turn cautious too early, I believe it is outweighed by the fact that I am bullish on the market (like December 2012) when the majority are not.
It is also important to follow my profit-taking advice as when a recommendation shows a nice quick profit, of say 10%, I generally recommend selling part of the position. Of course, stops must be used and one needs to accept the fact that not all recommendations will be profitable. By keeping the risk low on each position, the impact on your portfolio is minimized.
There is a fairly full economic calendar this week starting with Retail Sales and Business Inventories on Tuesday, followed by the Producer Price Index and Empire State Manufacturing Survey on Wednesday. We get another reading on the manufacturing sector Thursday from the Philadelphia Fed Survey, along with the jobless claims and the Consumer Price Index.
The week finishes with Friday's reports that include Housing Starts, Industrial Production, and the initial reading for January on Consumer Sentiment.
What to Watch
In my last column of 2013 I gave my reasons for why I thought 2014 may not be a buy-and-hold year like 2013. I am expecting something more like 2012 when there were several sharp corrections. The technical evidence at the time did not show any signs yet of an intermediate- or long-term top. There were some daily divergences then and some have still not been resolved by the market surge in reaction to the FOMC announcement.
The market has been very resilient in the New Year as the declines seem to be well supported. Looking at the individual stocks, there are some that look quite negative such as those mentioned last week in 3 Market Dogs Still Barking as I warned that bottom fishing was dangerous.
On the other hand, some stocks like the homebuilders, appear to have completed their bottom formations suggesting we may be seeing a rolling correction. It would take a few consecutive down days to generate more meaningful sell signals that could lead to a deeper correction.
The five-day moving average of the S&P 500 stocks above their 50-day MAs bounced up to the 77 area early in January but has since dropped to 65. The five-day moving average has turned lower and at current levels indicates that the market is moderately risky. There would be a lower risk if it dropped into the 30-40% area.
The sentiment is still too high as 43.6% of individual investors are bullish, which is down from 55% two weeks ago. The bearish percentage was at 29% last week but is back to 25% now. The Total P/C ratio (as discussed recently) is still very low and a sign that sentiment is still way too bullish as few are buying puts.
NEXT PAGE: Stocks
|pagebreak|
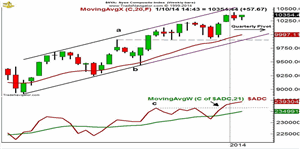
The weekly chart of the NYSE Composite shows the move to new highs since the week before Christmas and the higher weekly close last week. The weekly starc+ band is at 10,580 with the upper boundary of the trading channel (line a) a bit higher.
The most important development since the last column was the new highs in the weekly NYSE Advance/Decline as it broke well above the resistance at line c and confirmed the price action. If we get a correction, the A/D is likely to hold above the breakout level (line c) and its gradually rising WMA.
The daily studies still show some signs of deterioration as the McClellan oscillator peaked at +180 just before Christmas and has since drifted back to the +50 area.
There is next support at 10,150 with the rising 20-week EMA at 9996. The dashed line reflects the more important support at 9900. The quarterly pivot is at 10,082 and it will need to be watched on a weekly closing basis.
S&P 500
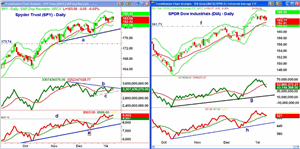
The daily chart of the Spyder Trust (SPY) shows the shallow uptrend over the past week or so with first good support now at $182. If this level is broken we could see a drop back to the stronger support, line a, in the $178.50-$180 area.
On a move above the all-time high at 4184.69, the next target is the daily starc+ band at $185.43. The monthly projected pivot resistance is at $189.60. The daily on-balance volume (OBV) continues to diverge from prices as it turned down from resistance, line b, on Friday. A break of support, line c, and the recent lows could trigger some heavier selling.
The daily S&P 500 A/D line did confirm the new highs as it moved well above the resistance from November. It is holding up quite well as it is still above its rising WMA.
Dow Industrials
The technical outlook for the SPDR Dow Industrials (DIA) has improved over the past few weeks as the recent pullback looks as though it is a pause in the uptrend. The next support is at $162.97 and the 20-day EMA, with stronger at $161.71, line f.
There is resistance now at $165.51 with the daily starc+ band at $166.30. The monthly projected pivot resistance for January is at $171.12.
The daily OBV made a convincing new high with prices at the end of the year but dropped below its WMA last week. This is consistent with a pullback as no divergences have formed.
The Dow Industrials A/D line also made a new high and has just pulled back to its rising WMA. There is more important support for the A/D line at the uptrend, line h.
Nasdaq-100
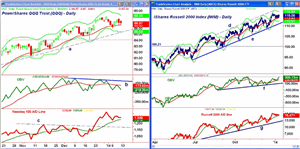
The PowerShares QQQ Trust (QQQ) has traded in a narrow range for the past several days and is just above the monthly pivot at $86.66. There is next strong support in the $85-$85.53 area, which corresponds to the daily starc- band and the uptrend, line a.
The daily OBV is acting weak as it tested the flat WMA last Thursday and then turned lower. A sharp drop early this week could move the OBV more firmly into the sell mode. The weekly OBV is still positive.
As was the case with the SPY, the Nasdaq 100 A/D line is acting much stronger than the OBV. The A/D line made a significant new high in late 2013 as it moved well above the resistance at line c. The A/D line is above its WMA and does not show a typical top formation.
Russell 2000
The iShares Russell 2000 Index (IWM) has been holding its rising 20-day EMA for the past eight days, which is typically a bullish sign. Once above the prior high at $115.97, the daily starc+ band is at $116.83, with the projected monthly pivot resistance at $120.20 as the next major upside target once the old highs are surpassed.
On a drop below the monthly pivot at $113.55, the next good support is in the $111.50-$112.50 area.
The daily OBV turned higher last week and is close to moving above the late October highs (dashed line). This would be a bullish sign for the small-cap stocks. The OBV bounced off its WMA a week ago giving a trigger buy signal that I discussed in the most recent trading lesson.
The Russell 2000 A/D line did confirm the upside breakout but was not too impressive. The A/D line is now testing its WMA but it would take some time before it could form a typical top formation.
NEXT PAGE: Sector Focus, Commodities, and Tom's Outlook
|pagebreak|
Sector Focus
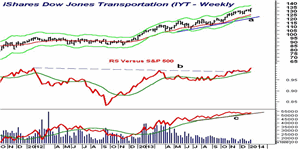
The iShares Dow Jones Transportation (IYT) led the market higher last week and is one of the top performers so far in 2014 as it is up around 1.3%. The weekly chart shows the close above the prior highs with the weekly starc+ band at $137.33.
The weekly relative performance analysis indicates IYT is still a market leader as it has confirmed the move through the long-term resistance at line b. It came close to its rising WMA two weeks ago. This is a bullish sign for both the economy and the stock market.
The weekly OBV is positive but has not yet made new highs as it just recent tested its WMA.
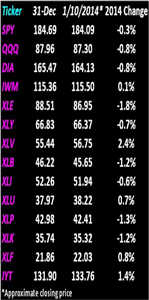
The ETF performance table this week looks at the performance so far in 2014 as most of the ETFs are lower so far this year. The Select SPDR Health Care (XLV) is leading the pack up over 2% with the Select SPDR Financials (XLF) and Select SPDR Utilities (XLU) up slightly so far in 2014.
Of the four market-tracking ETFs, the iShares Russell 2000 is flat while the others are lower so far this year.
The Select SPDR Energy (XLE) has been the weakest down almost 2% followed by 1.3% losses in the Select SPDR Staples (XLP) and the Select SPDR Technology (XLK). Just after Christmas I took a longer-term technical look at the various sectors, which you may find interesting.
Interest Rates
The yields on the 10-year T-note dropped on Friday in reaction to the weak jobs data and appear to have completed a short-term top as yields are now in a daily downtrend. Yields should find support in the 2.75-2.80% area and this decline should set the stage for a further rally this year.
Crude Oil
The drop in crude oil prices in 2014 has been a surprise as the February contract has lost over $8 per barrel in a short period of time. This makes the next few weeks important as crude typically bottoms in February.
Precious Metals
The Comex gold contract is up about $30 per ounce in 2014 and the weekly OBV has moved back above the zero line. The daily OBV did confirm the lows so it is a mixed picture currently. The gold miners are looking a bit better and I will update my outlook in the next week or so.
The Week Ahead
The stock market finished the year stronger than I expected but we easily achieved the double-digit gains that I was looking for at the end of 2012. It looks as though I may have been too cautious before Christmas as I took some profits in the Charts in Play portfolio and many of the stocks have moved even higher. At least we have a partial position. I have always favored being cautious when the short-term outlook is uncertain as it was then.
The action last week was more encouraging and is starting to favor another move to new highs. However, the divergence between the OBV and A/D line analysis still makes me concerned as a wave of heavier selling could reverse the positive signs from last week.
Therefore, I continue to favor a selective buying approach as three new long positions were established last week. There are several Dow stocks that I would like to buy at lower levels as the monthly relative performance and volume analysis looks strong.
If you are on the sidelines, I still feel confident that we will get a much lower-risk entry point in 2014, so I would urge you to be patient.
Don't forget to read Tom's latest Trading Lesson, Volume Always Precedes Price.

