
Russ Allen of Online Trading Academy, outlines the steps involved in finding opportunities in stocks that have unusually cheap options.
In the last two weeks’ articles, which you can read here and here, I discussed finding option opportunities by looking for stocks with unusually expensive options. A natural question is whether there are opportunities in stocks with options that are unusually cheap. And there are. In fact, if we can identify stocks that are at strong demand levels or supply levels, and which also have very cheap options, we have the most straightforward and potentially most profitable type of option trades.
The process of identifying these opportunities has a set of steps that are a bit different than those for expensive options, which we discussed in the previous two articles. Here, rather than selling, we will be buying options. What we’ll buy is calls if we’re bullish, or puts if we’re bearish, though it’s not quite as simple as that.
Here’s what we need to do to take advantage of cheapoption opportunities. The steps are listed first. Then we’ll walk through an example and describe each step.
1. Locate stocks with currently unusually lowimplied volatility (IV)—relative to their own IV history. Low IV means cheap options.
2. Using a daily price chart, determine if we have a good reason to be strongly bullish or strongly bearish on each stock. This will be the case only if the stock is near (within an average day’s range of) a high-probability turning point—a high-quality supply or demand level. Furthermore, there must be plenty of room for the stock to move after its reversal, enough for at least a 3:1 reward-to-risk ratio. Reject all the stocks that fail this test. This will eliminate most of the possibilities. The remaining stocks, if any, are our choicest opportunities. For each one:
3. Identify the stop pricethat we would be using if we were going to trade the stock itself. At what price would we exit the trade if it went against us?
4. Identify the target price for the next 30 days. At what price would we take our profit and exit the trade if it went our way during that time?
5. On the stock’s option chain, locate the nearest monthly expiration datethat is more than 90 days away.
6. For that expiration date, find the first in-the-money (ITM) strike price. If we are bullish and using call options, that is the next strike price belowthe current stock price; if we are bearish and using put options, it is the next strike price abovethe current price.
7. Calculate profitamount, with the stock at the targetprice and IV unchanged, 30 days from now. You must use option diagramming software for this (details below).
8. Calculate the lossamount, with the stock at the stop price and IV unchanged, 30 days from now. Reject the trade if the 30-days-out reward-to-risk ratio is less than 2 to 1.
9. Recalculate the 30-days-out profit and loss amounts, and reward-to-risk ratio, assuming that IV increases back to its one-year average. Reject the trade if the reward-to-risk ratio is not at least 3:1.
10. If all still looks good, place the trade.
11. Enter the order(s) to unwind the trade if the underlying hits the stop price.
This may seem like a lot of steps, just to buy calls or puts. Maybe so, but they’re not that tough, and each one is necessary. Leaving out one or more of these steps is what causes most new option traders to lose money. Let’s look at an example.
NEXT PAGE: First 6 Steps & Examples
|pagebreak|1. Locate stocks with currently unusually low implied volatility (IV)
The absolute numbers for implied volatility cannot be compared between stocks—there is no IV number that is absolutely low or high. The important thing is whether a stock’s current implied volatility is low or high for that stock.
I wanted stocks whose current implied volatility was in the bottom 5% of the past year’s range of IV. For example, if a stock’s implied volatility over the past year has ranged from 10% to 50%, then that is a 40-point range (50 – 10). Five percent of 40 points is 2 points. So if the current IV were between the low (10) and the low plus two points (10 + 2 = 12), then it would be in the bottom 5% of its range. Those are the stocks I scanned for.
As mentioned previously, the tool I use for scanning is the one integrated into the TradeStation’s trading platform. Other scanners are available inside of other trading platforms, and as standalone products. I ran a scan for stocks whose IV percentilewas 5 or less. In my scan, I also filtered out stocks whose prices were below $15 or whose daily average volume was less than a million shares a day.
On August 8, this scan turned up 39 stocks.
2. Using a daily price chart, determine if we have a good reason to be strongly bullish or strongly bearish on each stock.
Viewing each stock’s chart in turn, I rejected most within a second or two because they clearly were not near any kind of supply or demand zone. One good one, though, was Wynn Resorts Ltd. (WYNN). It was in the process of failing at a major supply zone. After recently making a new, lower high at $141.64, it was currently at $139.68. This was well within the $2.88 daily ATR (average true range) of that $141.64 high. It passed our test for a strongly bearish picture. Our plan would be to buy put options, which increase in value as a stock’s price goes down.
Wynn’s price chart is shown below.
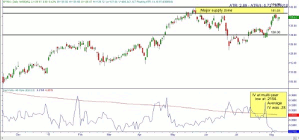
Click to Enlarge
3. Identify the stop pricethat we would be using if we were going to trade the stock itself. At what price would we exit the trade if it went against us?
In this case that would be the recent high at $141.64, plus a little breathing room, up to $142.00. If Wynn exceeded that, then our bearish expectations would be shown to be incorrect, and we’d take our loss while it was small.
4. Identify the target price for the next 30 days. At what price would we take our profit and exit the trade if it went our way during that time?
There was a strong demand zone at around $130. This was the area from which the last major rally was launched. We’d plan to sell the put options once WYNN reached that point.
5. On the stock’s option chain, locate the nearest monthly expiration date that is more than 90 days away.
Wynn had monthly expirations in August (9 days out), September (44 days), and December (135 days). The shortest expiration over 90 days was December. We want an expiration that will still have a large amount of time to go, at that time in the future when the stock hits our target. That is how we cash in on an increase in IV. A rise in IV increases only the time value portion of the option’s value. We can only benefit from that if we sell the options when they still have plenty of time to go. We selected the December expiration date.
6. For that expiration date, find the first in-the-money (ITM) strike price.
Below is the option chain for WYNN.
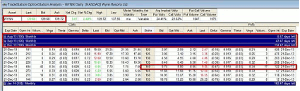
Click to Enlarge
With the stock at $139.68, the next higher put strike price was $140. The December 140 put was quoted at $8.75 bid, $8.85 ask. Midpoint between the bid and ask was $8.80. That’s the price we’d plan to pay.
That’s all we have space for today. Next time, we’ll complete the rest of the steps for this trade, see if it would have passed all the tests for entry, and if so, check out how the trade went.
By Russ Allen, Instructor, Online Trading Academy


