David Becker, at FXEmpire.com, explains that the moving average crossover strategy is designed to help traders find the middle of a trend. By citing a specific currency pair for support, David illustrates its use, and although he warns of false signals, he also shows how to enhance the strategy.
Moving Average Crossover
The moving average crossover strategy is geared toward finding the middle of a trend. A trend defines price action in which prices move in a specific direction over a period of time. Generally, trends are either upward or downward, as sideways movements are considered consolidation and not trends. Most of the time—approximately 70%—capital markets trade in tight consolidative patterns and only trend 30% of the time. With this in mind, it is important to be able to define a trend and jump on as soon as it is recognizable.
How to Capture a Trend
Short-term trends can be captured using short-term moving averages. A moving average is the average of a specific period, and when a new data point is added, the first period of the average is dropped. A moving average crossover strategy looks for periods when a short-term moving average crosses either above or below a longer-term moving average to define a short-term trend.
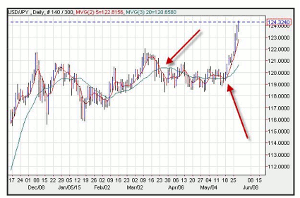
For example, when the 5-day moving average of the USD/JPY prices crosses above the 20-day moving average of USD/JPY prices, a short-term trend could be considered in place. One trading technique could be to purchase the USD/JPY prices when the moving averages cross over looking to ride an uptrend in the currency pair. By combining a short-, medium-term, and long-term moving average, an investor can attempt capture up, down, and sideways movements.

How to Enhance Your Moving Average Crossover Strategy
Click to Enlarge
Longer moving averages are gauged to capture longer-term trends within a financial market. When the 20-day moving average of gold prices crosses below the 50-day moving average, as seen in the chart of gold, a medium-term trend is considered in place.
Issues with a Standard Moving Average Crossover
The concept of a moving average crossover seems great, but a fundamental problem is that when the market is consolidating, a moving average crossover will give a number of false signals. During the period between April 2014 and April 2015, the 5/20 moving average crossover produced 5-signals that did not foreshadow a trend. This does not mean you would not have made money trading this strategy, but you would not have experienced an upward (or downward) bias in the currency pair that would be consider significant.
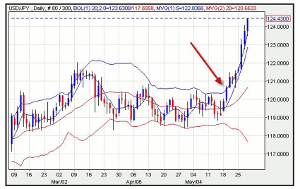
One way to enhance a moving average crossover strategy is to add an additional study that will weed out some of the false signals. For example, by adding a Bollinger band (created by John Bollinger, this study helps define a histogram of prices above and below a mean level) to the 5/20 crossover strategy, you can also help define a range.
In the case of the USD/JPY you could only purchase the USD/JPY currency pair when the 5-day moving average crosses the 20-day moving average and the exchange rate crosses above the Bollinger band high (2-standard deviations above the 20-day moving average) with an x days period. The number of days (x) is subjective, but using a period of less than 3-days is preferable. By adding an additional layer, the strategy becomes more robust, but also less frequent.
By David Becker, Contributor, FXEmpire.com


