
Thursday’s news-driven rally fizzled out, and with ominous bear flag patterns forming on the charts for several major stock indices, the short-term market action will be critical.
The close on Tuesday (August 23) suggested a short-term bottom was in place, which indicated that the major averages and ETFs should challenge or exceed last week’s highs. Wednesday’s higher close supported this view.
Stocks started off Thursday in a bullish mood following Warren Buffett’s investment in Bank of America (BAC), but the rally fizzled, which makes Friday’s action quite important.
If the financial media is correct in concluding that the market’s strength was based on today’s speech by Fed Chairman Ben Bernanke, it suggests that the market is really in weak hands. Though it is possible Bernanke will say something supportive for the markets, basing a trading or investing strategy on this hope is not really a strategy at all.
The primary concern now is that many of the key global markets show chart formations that are commonly referred to as “bear flags.” These are continuation patterns which are an interruption or pause in the overall trend. These will be confirmed by a break below Monday’s lows, which would signal another sharp market decline.
If the NY markets were forced to close because of hurricane Irene, and with overseas markets also weak, it could make any decline even worse.
Click to Enlarge
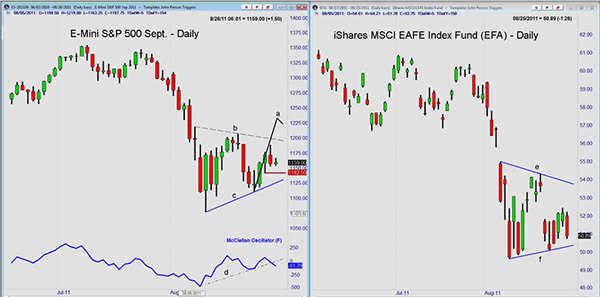
Chart Analysis: The daily chart of the September E-mini S&P 500 futures might be the best market to watch over the next few days. After Tuesday’s bullish close, I had been looking for a move to the 1225 area, such as I have drawn (line a) before the futures turned lower. To keep this scenario intact, the futures need to overcome Thursday’s highs at 1188.50.
- If Wednesday’s low at 1142.50 (red line) is broken instead, it is will make the completion of the bear flag formation, lines b and c, more likely
- A break of Monday’s low at 1111.25 will confirm a new decline and suggest a drop below the prior lows at 1077. A test of the 1000-1020 area is possible
- The McClellan Oscillator bounced to the +67 level Wednesday, but negative A/D numbers Thursday have broken the uptrend, line d, which is negative. This indicator often leads prices.
The iShares MSCI EAFE Index Fund (EFA) is designed to track the performance of publicly traded securities in the European, Australasian, and Far Eastern markets. The chart shows that EFA has had a much weaker rebound from the August lows, as it has not even come close to filling its gap from last week.
- There is key support now at $50.10-$50.35 and a break of this level would complete the flag formation, lines e and f
- A completion of the pattern has downside targets in the $45-$46 area
- EFA needs to close above the $52.45 level to reverse the deterioration
NEXT: Latest Chart Patterns for S&P 500 and Russell 2000
|pagebreak|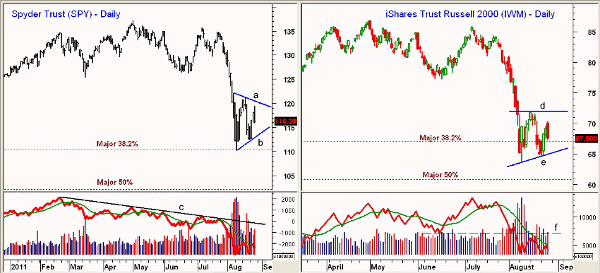
Click to Enlarge
The Spyder Trust (SPY) has also traced out a flag formation (lines a and b), as Thursday’s close was just barely above Wednesday’s low. The uptrend is now in the $113.40 area with Monday’s low at $112.41.
- There is a band of support from summer 2010 in the $105-$108 area. A completion of the flag formation has downside targets in the $101-$102 area
- The major 50% retracement support is at $102.14
- The on-balance volume (OBV) has just dropped back below its weighted moving average (WMA) and is well below its downtrend, line c
- Initial resistance is at $118-$119.40 with further resistance in the $120.40 area
The iShares Russell 2000 Index Fund (IWM) has already broken the major 38.2% support levels, which makes the next likely target the 50% support in the $60.54 area.
- The support from the July 2010 lows is at $58.66 and the downside target from the flag formation (lines d and e) is in the $56 area
- The volume has been low over the past week and the OBV has stayed below its weighted moving average and the former support at line f
- There is first resistance now in the $70.30-$71.89 area (line d)
What It Means: The rally failure on Thursday certainly turns the focus to the downside and the weaker relative action in many of the key global markets is a concern. The late decline in the German DAX on Thursday clearly hurt the US market. The DAX was down another 2.2% before the release of the GDP report.
A more defensive position is certainly warranted, as another 10% decline is possible from current levels. The GDP report was released and came in as expected at 1%. So far, the futures are down only slightly after the report. How the market stands going into the last hour of trading will be important.
How to Profit: Hopefully you trimmed your portfolio on last week’s rally above 1200 in the S&P 500. Since premiums are high, hedging your portfolio with index put options may not be the best strategy.
If you have existing long stock positions in some of the sectors that I have recently favored, I would suggest selling in-the-money call options against these positions, especially if the S&P 500 and Advance/Decline (A/D) numbers are negative an hour before the close.
Those who want to cut it closer in hopes the Fed will do something, be sure to have your strategy ready in case the market is disappointed.
On Wednesday, I advised that aggressive traders buy the Direxion Daily Semiconductor Bull 3X Shares (SOXL) at $24.36 with a stop at $22.44. It closed at $23.33. Raise the stop to $23.03 and close out the position at $23.84-$24.14.


