These Dow stocks are part of a very select group to have gained this year, and all show bullish chart patterns and would be good buys on a further market correction.
Friday’s sharply lower close likely sets the stage for more selling this week. For the year, the Dow Transportation Average and the small-capitalization stocks have been hit the hardest, as both are down close to 13% for the year. Of course, the NYSE Financial Index is even worse, having declined almost 18% this year.
According to The Wall Street Journal, anyone who invested $1000 in each of the Dow’s 30 stocks and reinvested the dividends would have lost 5.7%. Still, there are nine stocks in the Dow Industrials that are up for the year (including re-invested dividends).
I have listed the nine Dow winners in order of how close each stock is to its weekly Starc+ bands. The closer the proximity to the weekly Starc+ band, the more risk there is for new long positions.
For example, The Coca Cola Co (KO) closed at $69.74 with the Starc- band at $63.86 and the Starc+ band at $72.76. KO closed 4.3% below the Starc+ band and 8.6% above the Starc- band. Therefore, it is moderately overbought.
Of the nine stocks, there are four that look interesting to me technically, and any further market decline should set up good buying opportunities.
NEXT: See Charts for These 4 Dow-Leading Stocks
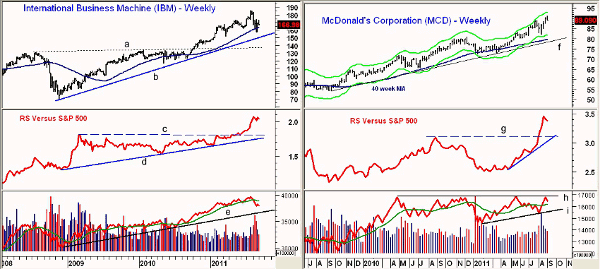
|pagebreak|Chart Analysis: In February 2010, International Business Machines (IBM) broke out of a ten-year trading range, and at the time, I gave upside targets in the $185-$200 area. In July, IBM hit a high of $185.63, and by early August, it hit a low of $157.13 when it dropped below the weekly Starc- band and the rising 40-week moving average (MA).
- The March low and the weekly uptrend (line b) are in the $150-$152 area, which should hold on a further decline. There is major chart support at $135, line a
- The relative performance, or RS analysis, has been in a strong uptrend, line d, since early 2009. It broke through resistance (line c) in May and IBM bottomed out a few weeks later
- The weekly on-balance volume (OBV) did confirm the most recent high, but it has recently dropped below its weighted moving average (WMA). Long-term support is at line e
- There is initial resistance in the $173-$174 area
McDonald’s Corp. (MCD) is a stock that I have written about frequently, and in mid-April, I recommended it as a weak dollar play. I reviewed in detail the trading strategy during a June Trading Lesson. MCD made a new rally high last week at $91.22 and closed Friday just 4.5% below the Starc+ band. It pays a dividend of $2.44 and currently yields 2.7%
- The Starc- band is at $82.04 with the 40-week MA and the uptrend (line f) in the $78.50-$80 area
- The RS made another new high in the past few weeks after overcoming resistance at line g
- Weekly OBV has turned down from resistance (line h) but is above its weighted moving average
- The daily volume (not shown) did confirm the recent highs but is now back below its WMA
- There is initial support for MCD at $86-$87 with further support in the $84 area
NEXT: Favorable Set-Ups in 2 Top Dividend Stocks
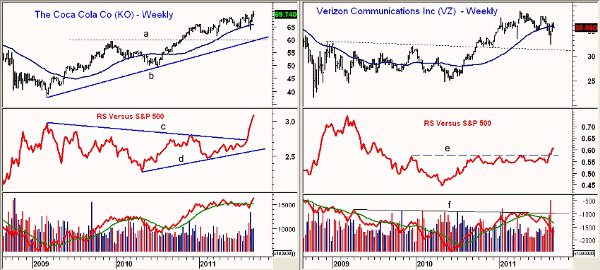
|pagebreak|Coca Cola Co (KO) also made new highs last week at $71.10 and held up well on Friday. It closed 4.3% below the Starc+ band at $72.76. The weekly chart looks very strong with a pattern of higher highs and higher lows. KO pays a dividend of $1.88 and currently yields 2.7%
- The RS completed a multi-year triangle formation, lines c and d, at the end of July, signaling the recent strength
- The weekly OBV confirmed the new highs last week and is well above its flat weighted moving average
- There is first support now for KO at $67-$68.50 with the early-August lows at $63.59
- There is major support in the $60-$60.50 area, which corresponds to the 40-week MA and the support from the 2010 high, line a
Verizon Communications Inc. (VZ) peaked in April at $38.95 and has formed a series of lower lows. The August low at $32.38 was below the March lows. It currently pays a dividend of $1.95 for a yield of 5.4%.
- There is strong support on the weekly chart at $31.60-$32 (dashed line)
- The weekly RS analysis broke out to the upside (line e) in the past month, which likely completes a major bottom formation
- The weekly OBV has not yet confirmed the breakout, as it has key resistance at line f. The OBV is below its weighted moving average
- The daily OBV still looks negative, so a drop back to stronger support looks likely
What It Means: Given the difficult market conditions, these four stocks have clearly bucked the trend and all except Verizon Communications Inc. (VZ) show a clear pattern of higher highs and higher lows on the weekly charts.
For those who are underinvested in stocks and do not believe that the financial system is ready for another collapse like 2008, these four stocks look attractive on further weakness.
How to Profit: For International Business Machines (IBM), go long at $152.60 with a stop at $148.42 (risk of approx. 2.74%).
For McDonald’s Corp. (MCD), go long at $85.18 (for a yield of 2.86%) with a stop at $78.82 (risk of approx. 7.4%).
For Coca Cola Co (KO), go long at $64.56 (for a yield of 2.91%) with a stop at $60.44 (risk of approx. 6.4%).
For Verizon Communications Inc. (VZ), go long at $31.78 (for a yield of 6.14%) with a stop at $29.62. (risk of approx. 6.8%).


