Stocks and gold are in the sweet spot of important seasonal patterns that could present good buying opportunities despite low-volume trading around the holidays.
Just four trading days remain in 2011, and while volume is expected to be low, that does not mean we should ignore the markets this week.
As discussed earlier this month, the typical seasonal pattern is for stocks to bottom in November and then stay strong into May. If you look at the daily data, the Spyder Trust (SPY) typically has a short-term bottom on December 19, which is precisely when it made its recent low.
The S&P 500 Advance/Decline (A/D) line has broken through resistance and is acting stronger than prices, suggesting the rally can continue into early January. Typically, stocks will form their next short-term low at the end of January.
There are quite a few stocks that show double-bottom formations, and one low-priced health care stock has already completed its double bottom.
Investors are also closely watching the gold market, and the increasing tide of bearish articles on gold is what is needed before a bottom can be completed. On a seasonal basis, gold typically tops in February, and the technical evidence discussed below suggests that one more drop could set up a good buying opportunity in the SPDR Gold Trust (GLD) as well as one widely followed gold mining stock.
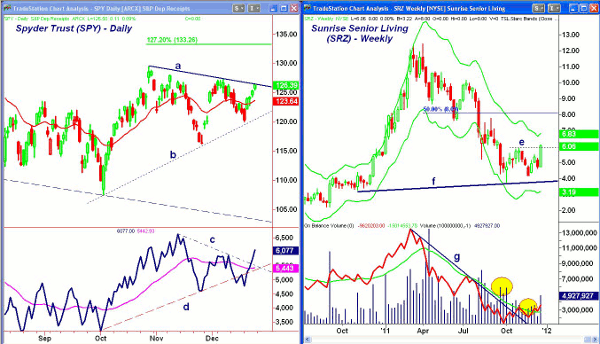
Chart Analysis: The Spyder Trust (SPY) closed above its flat 200-day moving average (MA) at $126.17 on Friday and is very close to breaking its downtrend, line a.
- The completion of this flag formation (lines a and b) has Fibonacci targets at $133.26
- Major chart resistance from last summer is in the $134.80-$135.70 area
- The S&P 500 A/D line has broken its downtrend, line c, and has moved above its early-December highs
- The S&P 500 A/D line is still below the November highs while the NYSE A/D line is acting much stronger
- It now looks as though the break of the uptrend (line d) in the A/D line was false
- There is initial support at $125 with stronger support at $123.30-$124
Sunrise Senior Living (SRZ) is a small-cap health care company that provides senior living services in the US. The stock peaked at $12.44 in April 2011 but traded as high as $42.97 in June 2007.
- SRZ hit a low of $3.68 in October and held well above $4.00 in the latter part of November
- The close above resistance at $5.90 (line e) completed the double-bottom formation with upside targets in the $8-$8.20 area. This also corresponds to the 50% Fibonacci retracement resistance
- The volume was considerably higher at the October low than it was in late November (see circles)
- The weekly on-balance volume (OBV) broke its downtrend, line g, in late October
- The relative performance, or RS analysis (not shown), has completed its bottom formation
- There is short-term support now at $5.70-$5.90 with stronger support at $5.30-$5.40
NEXT: How to Spot Upcoming Opportunities in GLD |pagebreak|
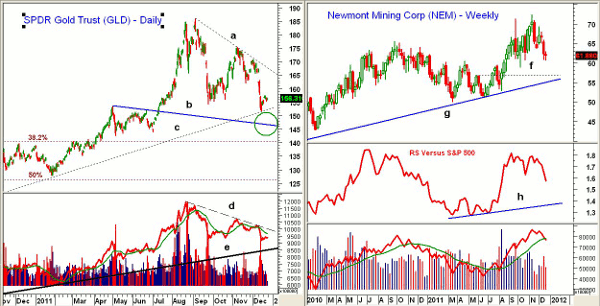
The SPDR Gold Trust (GLD) bounced last week, but the gold futures were a bit lower early Tuesday. The daily uptrend, line c, is now at $152, which is just above the recent lows at $151.70.
- The minor 61.8% Fibonacci support level is at $150
- As noted earlier this month, the equality targets are in the $143.50 area
- A retest of the July breakout level would mean a decline to the $147 area with the 38.2% Fibonacci support from the 2008 lows just above $140
- The daily OBV is still below its declining weighted moving average (WMA) with long-term support at line e
- The weekly OBV (not shown) turned up last week but is still below its weighted moving average
- There is first resistance now at $157.50 with stronger resistance at $162
Newmont Mining Corp. (NEM) had a high in November at $72.42 and is now down over 14% from the highs. There is next support at $60.30-$59.70 with stronger support in the $56.90 area (line f).
- The long-term weekly uptrend, line g, is now at $55.28
- The weekly relative performance, or RS analysis, completed its bottom formation in August but has been declining for the past five weeks
- The daily RS analysis (not shown) suggests it is just correcting, not forming a major top
- The weekly OBV has just dropped below its weighted moving average but did confirm the recent highs
- There is first resistance at $63.20 and then stronger resistance above $66
What It Means: The action of the A/D line is positive and suggests that stocks are likely to test and probably surpass the November highs. Year-end window dressing by underinvested portfolio managers should also be a positive for stocks.
Though there are no daily buy signals, another wave of selling is likely to be an opportunity for those not invested in the gold market to look at the SPDR Gold Trust (GLD).
How to Profit: For Sunrise Senior Living (SRZ), go 50% long at $5.76 and 50% long at $5.32 with a stop at $4.49 (risk of approx. 19%). If filled, move the stop to $5.19 once $6.60 is overcome.
For the SPDR Gold Trust (GLD), go 50% long at $148.20 and 50% long at $144.80 with a stop at $139.56 (risk of approx. 4.7%).
For Newmont Mining Corp. (NEM), go 50% long at $60.12 and 50% long at $59.20 with a stop at $55.18 (risk of approx. 7.5%).


