
Recent deterioration in the short-term technical outlook for key indices means now more than ever, investors must take decisive action to lock in recent gains and avoid aggressive buying.
The markets were clearly disappointed early Friday as more cracks developed in Greece’s debt deal. Still, most of the major averages managed to close higher on Thursday. Over the past week or so, the correction camp (those looking for a pullback to buy) has become quite crowded.
This is likely the reason why the market has been grinding higher as late buyers abandon their disciplined strategy and just buy. Many of the market-leading sectors like housing have continued to move higher and have become even more overextended. Further new all-time highs in Apple Inc. (AAPL) have also helped fuel the excessively bullish sentiment.
The latest American Association of Individual Investors (AAII) sentiment survey shows a 7%+ jump in the number of bulls, which now stands at 51.6%. According to Investors Intelligence, over 52% of the newsletter writers are also now bullish. Though neither reading is high enough to suggest a major top, they do raise a further caution flag. (See the results of MoneyShow.com’s latest sentiment survey here.)
The weaker relative performance of the Dow Industrials and Dow Transports suggests that the more speculative sectors are gaining favor. This combined with some deterioration in the short-term technical outlook suggests it is time to tighten your stops and lock in some profits.
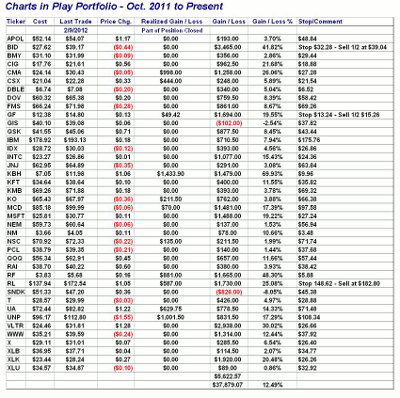
At the end of today’s column, you will find a summary of all my executed positions since last October along with the recommended stop levels.
Click to Enlarge
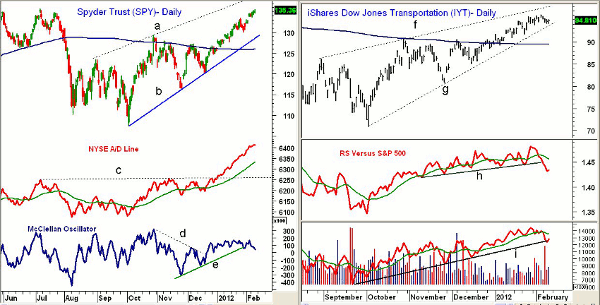
Chart Analysis: The Spyder Trust (SPY) has closed higher for the past three days after successfully overcoming the 127.2% Fibonacci price target at $133.39 last week.
- Daily Starc+ band is now at $136.90 with the 2011 high at $137.18. The major 78.6% retracement resistance calculated from the 2007 highs is at $138.26
- The NYSE Advance/Decline (A/D) line has made further new highs this week and is well above the July highs (line c), which were surpassed in December
- A/D line is well above its rising weighted moving average (WMA), which is consistent with an overbought market
- The McClellan Oscillator did a good job of signaling the 2012 rally by breaking its downtrend, line d
- The break below the uptrend on the McClellan Oscillator support (line e) is also a sign of weakness. It may drop below zero on Friday if stocks are down
- Rising 20-day exponential moving average (EMA) is now at $131.90 and there is good chart support in the $130-$132 area
- A close below the low at $130.06 will suggest a drop to $128.30-$127.20, if not the flat 200-day moving average (MA) at $125.95
The iShares Dow Jones Transportation ETF (IYT) has declined for most of the week while many of the other major averages have continued to make new highs.
- The daily chart shows a potentially bearish rising wedge formation, lines f and g
- A drop below support (line g) will suggest a drop back to the 200-day MA at $89.50. Calculated from the recent highs, the 38.2% support stands at $86.60, which is over 8% below current levels
- RS line has dropped below its support, line h, signaling that it is underperforming the S&P 500. The weighted moving average is also starting to turn lower
- OBV has broken its uptrend, line I, after forming a slight negative divergence at the recent highs. A lower close Friday would turn it even more negative
- There is initial resistance now at $95.40-$96 with stronger resistance in the $98 area
NEXT: Weak Dow Performance Raises Warning Flag
|pagebreak|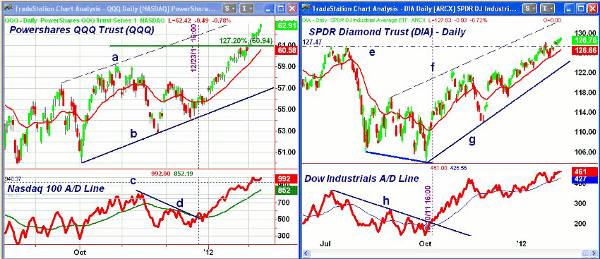
Click to Enlarge
The PowerShares QQQ Trust (QQQ), which tracks the Nasdaq 100, has continued higher after overcoming both the 127.2% equality target at $60.54 at the start of February.
- Upper trend line resistance, line a, is now in the $63.60 area with the weekly Starc+ band at $64
- The Nasdaq 100 A/D line has been strong since breaking its downtrend, line d, on December 23. It has made further new highs this week and is well above the July highs, line c
- There is initial support at $61.40 to $61.90 with the rising 20-day EMA at $60.58. Further support stands in the $59.25-$59.50 range
- The daily uptrend, line b, is now in the $57 area
The SPDR Diamonds Trust (DIA) tracks the Dow Industrials and led the market higher into the middle of December, though it has been lagging since. It is still holding just above the April 2011 highs at $128.63.
- Daily Starc+ band is now at $130.45 with the weekly Starc+ band just above $134
- The Dow Industrials’ A/D line broke its downtrend on October 10 but has lost upside momentum in the past month, as evidenced by comparing the slope of the Dow’s A/D line with that of the Nasdaq 100
- A/D line made marginal new highs this week, and a drop below the January 30 low would be more negative
- There is first good support at $126.50-$126.70 and the rising 20-day EMA. There is more important support at $125
What It Means: New questions surrounding Greece’s debt deal are pushing the stock index futures sharply lower early Friday. In the past few weeks, the early selling has been well absorbed by the market, but today may be different.
A sharply lower close on Friday will suggest that a short-term top may be in place. While any correction may be small (3%-5%), a deeper correction is also possible.
How to Profit: As I have been suggesting for the past few weeks, investors should be taking profits, raising stop levels, and avoiding any aggressive buying.
NEXT: See the Complete Portfolio with Stop Levels
|pagebreak|This table reflects all the open positions from my recommendations in the Charts in Play column since the start of October 2011. This is updated through the close on February 9 and reflects the entry price adjusted for a $10 commission to take care of slippage. On the far right, I have also included the recommended stop levels.
Click to Enlarge
I will be going into more detail about the portfolio in the coming weeks, including how the size of each position was determined.


