
With gold closer to forming a bottom, now is a good time to initiate new long positions in the SPDR Gold Trust (GLD) and a popular gold miner that pays a healthy dividend.
The outlook for the gold market has certainly changed considerably in the past eight months, as last September many were looking for gold to move well above $2000 per ounce before the end of the year.
Back then, the outlook for the gold miners was even more enthusiastic with headlines like this one from September 19: “Gold Heading Higher Is a Certainty.” Technically, the outlook was much different, as the Market Vectors Gold Miners ETF (GDX) peaked at $66.90 two days after this headline was released. By the end of the year, GDX closed at $51.43, which was a drop of 23% from the September highs.
The negative technical action carried over into 2012, and last month (see “Red Flags Preceded Gold Miners' Plunge”), I discussed the completion of the continuation pattern in GDX that projected another 6%-10% decline.
It has been my view since last September that the correction in gold was likely to be an interruption in the major trend, but that it would need to last long enough and take gold prices low enough to turn the sentiment negative.
Last summer, it was almost un-American to be negative on gold, but over the past few weeks, there have been some subtle signs that gold may finally be bottoming. The April 16 headline in the Wall Street Journal that read “Gold Bulls Ponder End of Long Rally” caught my attention, as it reflected the type of sentiment that is needed before gold could complete a bottom.
Now there has also been some technical improvement, which is consistent with the formation of a bottom. Even though another drop is still possible, the technical action suggests it is now time to start buying the SPDR Gold Trust (GLD), and there is one high-yielding gold miner that I also think should be accumulated.
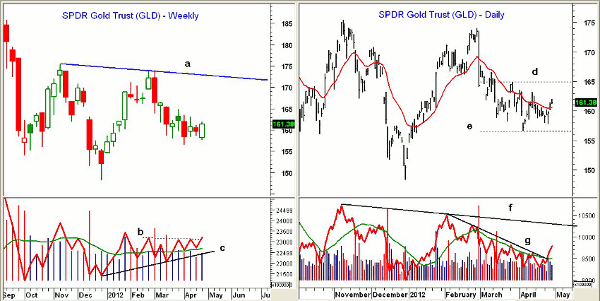
Click to Enlarge
Chart Analysis: The SPDR Gold Trust (GLD) had its highest weekly close in over a month, but the ranges still remain fairly tight with next resistance at $163.50-$166.70.
- There is major resistance in the $172 area, line a, and a close above this level will support the view that the correction is over
- While GLD has been drifting lower, the weekly on-balance volume (OBV) has held above its slightly rising weighted moving average WMA and closed above first resistance at line b
- Weekly OBV has improved since the December lows, line c
- On the weekly chart, there is support now at $156.56 and then at $150-$152
- The December low and the weekly Starc- band are in the $148-$148.50 area
The daily chart of the SPDR Gold Trust (GLD) more clearly shows the recent trading range with the 20-day exponential moving average (EMA) now at $160.48.
- There is first resistance on the daily chart, line d, in the $165 area with additional chart resistance in the $168-$170 area
- Volume picked up late last week and the daily OBV has broken its initial downtrend, line g
- OBV needs to overcome the longer-term resistance at line f to confirm that GLD has bottomed
- There is weekly pivot support now at $158.70
NEXT: A Gold Miner Worth Buying Now
|pagebreak|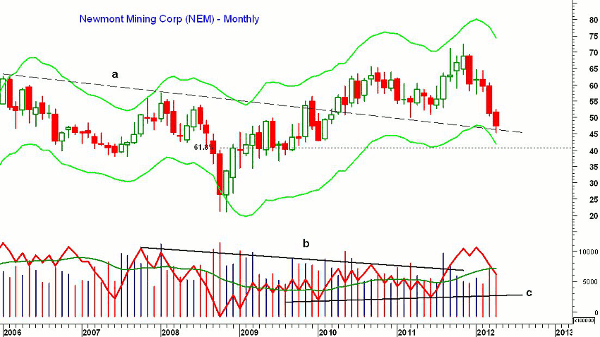
Click to Enlarge
Newmont Mining (NEM) is a $23.7 billion gold and copper mining company with reported gold reserves of just under 100 million ounces. The stock currently yields 2.9%, and its dividend has risen from three cents in 2000 to 35 cents per quarter now.
- Monthly chart analysis suggests that NEM is near a low, as the former downtrend, line a, in the $46.40 area has been retested
- The monthly Starc- band is now in the $42 area with the major 61.8% retracement support is at $40.80
- Monthly OBV surged last summer and overcame multi-year resistance at line b
- The downside volume over the past three months has not been quite as heavy
- Monthly OBV is back below its weighted moving average but well above major support, line c
- Weekly OBV (not shown) is still negative, while the daily OBV is slightly positive
- There is initial resistance now at $48 and then further resistance at $50-$52
- First monthly resistance is now at $55-$57
What It Means: Commitment of Traders (COT) sentiment data for gold futures now shows a fairly high level of bearish sentiment quite similar to what was seen at the December 2011 lows.
In early April, I was looking for three specific price and volume signs to confirm that GLD had bottomed. The recent technical improvement has reduced the risk on the long side.
A two-stage buying process is recommended, especially for Newmont Mining (NEM), which could make another new correction low in the next week or two. The weak technical action of the Market Vectors Gold Miners ETF (GDX) keeps me from buying it or individual gold miners for now.
How to Profit: For the SPDR Gold Trust (GLD), go 50% long at $160.66 and 50% long at $158.78 with a stop at $153.88 (risk of approx. 3.6%).
For Newmont Mining (NEM), go 50% long at $44.42 and 50% long $42.82 with a stop at $39.78 (risk of approx. 8.9%).


