A positive signal from the Dow Transports suggests the bulls are winning out, and with odds favoring a short-term pullback, patient investors may find buying opportunities in select stocks and index ETFs.
Stocks put in another impressive performance on Tuesday, and investors seem to be expecting a market-friendly announcement from the Fed this afternoon. The confirmation of the bullish divergences I discussed on June 6 (see “Rally Potential That Bears Don’t Expect”) has kept the focus on the long side of the market.
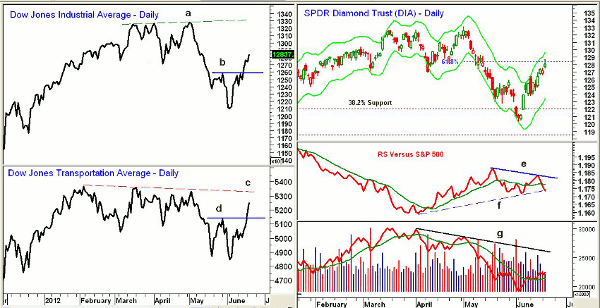
This week’s action in the Dow Transportation Average was significant, as it was able to surpass the May 29 highs. This confirms the action in the Dow Industrials and both are now pointing higher.
Many market bears who were preparing for Armageddon just two weeks ago have now been forced to cover their short positions. This has many investors wondering if they should be buying at this point, and though I do expect the market to be higher in the next month, the short-term technical readings (see below) as well as the close proximity to more important resistance makes the market increasingly vulnerable to a pullback.
As a result, I would not be chasing the long side of the market at current levels because the short-term risk seems too high. Our strategy of buying at major support allowed us to pick up some good stocks while the market was making its lows. If we get a correction it should be a buying opportunity. (See the current “Charts in Play” Portfolio here.)
Chart Analysis: The daily chart of the Dow Jones Industrial Average (top left) shows that it plunged after making higher highs (line a) in early May. As I pointed out at the time, the Dow Industrials’ Advance/Decline (A/D) line did not confirm those highs, thus setting the stage for the market’s plunge.
- The Dow Industrials made lower lows in early June before reversing course
- On June 14, the Industrials closed above the resistance at line b, starting a new pattern of higher highs and higher lows
- There is major resistance now in the 13,000-13,200 area
- The daily close-only chart of Dow Transportation Average (bottom left) shows that it made its highs in March and then formed lower highs in early May, line c
- The Transports also made lower lows in early June and had been lagging the Industrials
- This underperformance changed on Tuesday, however, when the Transports closed above resistance at line d, thus confirming a new uptrend
- The Transports have major resistance in the 5280-5380 area
The SPDR Diamond Trust (DIA), which is the primary Dow tracking ETF, pushed above the 61.8% Fibonacci retracement resistance at $128.17 on Wednesday but closed just below it. There is further resistance at $129 with the daily Starc+ band at $129.70. The 78.6% resistance is at $130.34.
- Relative performance, or RS analysis, has formed lower highs since mid-May, indicating that it has been performing weaker than the S&P 500
- The RS line is now very close to breaking its uptrend, line f, suggesting large-cap stocks may underperform the broader S&P 500
- Daily on-balance volume (OBV) is above its weighted moving average (WMA) but has not been impressive, as it is well below its downtrend, line g
- There is initial support in the $126.40-$126.80 area with the 20-day exponential moving average (EMA) at $125.60
- Major 38.2% retracement support from last October’s lows was broken in early June
NEXT: The 2 Best-Performing Index ETFs for This Market
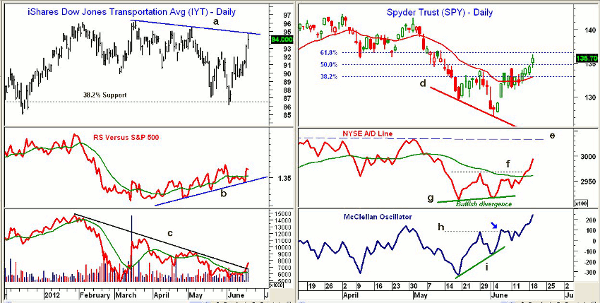
|pagebreak|The iShares Dow Jones Transportation Average Index Fund (IYT) tested its daily downtrend, line a, on Wednesday. There is further resistance in the $95.57-$96.22 area.
- Relative performance is in a shallow uptrend from the April lows, line d, and is above its weighted moving average
- Volume increased over the past few days, as the OBV broke its downtrend, line c. OBV is still below the May and March highs
- There is first support in the $92.50 area with more important support in the $91-$91.30 area
- IYT tested the 38.2% support in early June but did not close below it
The Spyder Trust (SPY) came very close to the 61.8% retracement resistance on Wednesday at $136.45. If this level is overcome, there is further chart resistance in the $137-$137.50 area.
- The NYSE A/D line formed a positive divergence at the June lows (line g), forming higher lows while prices made lower lows, line d
- The divergence was confirmed by the move above resistance at line f
- The A/D line is above its weighted moving average and needs to overcome major resistance at line e to signal that a major new uptrend is underway
- The McClellan Oscillator also formed a bullish divergence that was confirmed two days after the lows
- The McClellan Oscillator is rising strongly and is at a new high for the year at +244. It reached +314 at the October 2011 highs
- Initial price support for SPY is at $133.80-$134.20 with further support at $132.80-$133
What It Means: Sentiment has certainly changed since early June, and the recent lows provide a good example of how divergence analysis of the market internals can be used as a valuable market timing tool.
The recent strength of the Dow Jones Transportation Average is a positive sign for the overall markets and the economy, and monitoring the trend of the Dow Averages has been a reliable and successful analytical method for 80 years (see also “80-Year-Old Wisdom That Still Works”).
On a short-term basis, the bullish camp seems to be getting a bit crowded, which increases the odds of a pullback that could last several days. I favor buying individual stocks on a pullback, but for those who prefer ETFs, IYT and SPY should outperform DIA.
How to Profit: For the iShares Dow Jones Transportation Average Index Fund (IYT), go 50% long at $91.64 and 50% long at $90.88 with a stop at $85.32 (risk of approx. 6.5%).
For the Spyder Trust (SPY), go 50% long at $133.22 and 50% long at $132.08 with a stop at $126.28 (risk of approx. 4.8%).


