Many active investors try to monitor hedge fund positions to get an idea of what the “smart money” is doing, and now some are making big bets on Japan. But the technical action, says MoneyShow’s Tom Aspray, suggests they may be betting on the wrong side.
Even though last Friday’s rally was not that impressive, it did lessen the downside pressure on the stock market, and early Monday stock futures have added to last Friday’s gains.
There are still quite a few hurdles facing the stock market (Gaza, Greece or the Fiscal Cliff?), and there are no signs yet the US market’s decline is over.
Some of the other global markets continue to act much better. Japan’s Nikkei-225 Index is up over 6% since last Tuesday’s low, including a 1% gain in Monday’s session. Despite the worsening economic news out of Japan, the index is now just 1.5% below its September high.
It appears that many of the big hedge funds are betting on more weakness, as they are bidding up the prices of credit-default swaps on some of Japan’s largest companies.
So far this trade is working for them, but several well-known hedge fund managers were proclaiming their bullish stance back in early 2011 and the Nikkei fell 17% for the year. Does the technical outlook support their stance now?
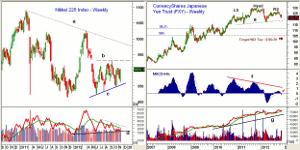
Chart Analysis: The weekly chart of the Nikkei-225 Index peaked in February 2011 at 10,891, and the long-term downtrend (line a) is still intact.
- As of last Friday, the Nikkei 225 is up 1% in November, versus a 3.9% decline in the Spyder Trust (SPY)
- In 2012, the Nikkei has formed a series of higher lows (line c), with next resistance at 9,300 (line b).
- The weekly on-balance volume (OBV) has turned up from yearlong support (line d).
- A move in the OBV above its WMA and the downtrend (dashed line) are needed to signal that a bottom is in place.
- There is first support now at 8,800 to 8,900, and then at 8,650 to 8,700.
The weekly chart of the CurrencyShares Japanese Yen Trust (FXY) shows that a three-year head and shoulders top appears to be forming. A close below the neckline at $118.50 is needed to confirm the top formation.
- FXE peaked in September at $125.85. Once below $118.50, the next good support sits in the $115 area.
- The major 38.2% Fibonacci retracement support is at $111.32, with the 50% support at $105.40.
- The MACD-His peaked as the LS (left shoulder) was forming, and made lower highs as FXE was peaking in 2011.
- The MACD-His was even weaker in September, and the negative divergence (line f) is consistent with a major top.
- The drop in the MACD-His below the zero line last week (see arrow) is also a sign of weakness.
- The weekly OBV is still holding above its WMA. and is well below the uptrend (line g).
- There is initial resistance at $122.60 to $123.30. Major resistance follows at $125.36, which was the RS high.
NEXT: Which Way Should You Invest in Japan?
|pagebreak|The WisdomTree Japan Total Dividend Index (DXJ) has a current yield of 1.85%, trades an average of 176,000 per day, and has an expense ratio of 0.48%. The ETF uses futures contracts to neutralize its yen exposure.
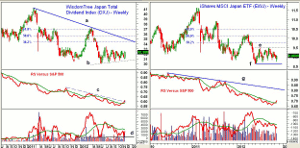
- DXJ closed strong last week, and shows a well established base (line b), with important support now at $30.07 to $30.49.
- The relative performance or RS analysis broke its downtrend (line c) last week, suggesting that it is now outperforming the S&P 500. A clear pattern in the RS line of higher highs and higher lows will support this view.
- Volume picked up in the past two weeks, but the OBV is still below its WMA. The OBV has good support now at line d.
- Once above initial resistance at $32.80 to $33.48, the 38.2% Fibonacci retracement resistance is at $34.37.
- The weekly downtrend (line a) is at $35.47, with the 50% resistance at $35.62.
The iShares MSCI Japan ETF (EWJ) is a $4.1 billion, very liquid ETF that yields 2.14%. It peaked in early 2012 at $10.20, and had a high in early 2011 at $11.62.
- The weekly chart has support at $8.64 (line f), with resistance at $9.50 (line e).
- The 38.2% Fibonacci retracement resistance is at $9.78, with the 50% resistance at $10.13.
- The relative performance has moved back above its WMA, but is still well below the long-term downtrend (line g).
- The OBV has been below its WMA since the middle of May, but has now turned up.
- EWJ closed last week well off the lows, at $8.75.
What it Means: The technical outlook for the Japanese stock market does look better than the recent dismal economic numbers would suggest. The yen appears to be completing a major top, and a weaker yen will be a positive factor for its economy.
This is supports my view that there may be better opportunities investing overseas. For Japan, the WisdomTree Japan Total Dividend Index (DXJ) looks to be the best bet. Its hedging will help it offset any downside from a weaker yen. The nice base formation in DXJ allows for a stop level to be well defined.
A long-term top is likely forming in the yen, but a stop in FXY would need to be above the RS high, so the risk is a bit too high. Also, unfortunately, its options are not very liquid.
How to Profit: For WisdomTree Japan Total Dividend Index (DXJ), go 50% long at $32.02 and 50% long at $31.74, with a stop at $29.82 (risk of approx. 6.4%).


