With the yield on the 10-year T-note rising to its highest level in two years, MoneyShow’s Tom Aspray revisits high-yield securities to see how they are faring in this new environment.
Global markets have become fixated on rising rates with some financial media anchors wondering if the increase in rates will end the stock market rally. They seem oblivious to the fact that the Spyder Trust (SPY) is already down 3.6% from its highs.
Oftentimes when the majority finally realizes a trend, it coincides with a short-term top. The T-bond yields completed the reverse head-and-shoulders bottom formation at the end of May when yields closed at 3.308%. The yields have continued to rise since then and are now up almost 18% since the end of May.
This has had very unfortunate consequences for those who moved into bond funds after the last bear market as they searched for safety. Many did not realize that they could suffer capital losses that would be much larger than the dividends they received.
Even more reckless investors and advisors have been chasing the highest yields over the past few years without regard to the risk. As I pointed out in August 2011 “One of the first lessons income investors normally learn is that when one instrument has a much higher yield than others, it is a signal that the risk is also much higher.”
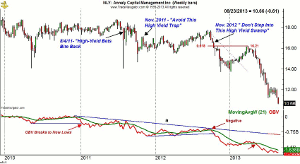
In this article, I cautioned that investors should be aware of the risks in investing in stocks like Annaly Capital Management Inc. (NLY), which was then yielding 15.75 %. Just two months later it had dropped over 10% and was yielding over 17%.
By November 11, 2011, NLY had rebounded sharply but technically still looked weak as I recommended that investors Avoid This High-Yield Risk Trap. The technical outlook in March of 2012 was still negative but NLY still rallied into September of 2012, which helped investors become more complacent.
I had pointed out that one of the other high-yield favorites Anworth Mortgage Asset Corp. (ANH) had just $8.8 million in cash with a debt of a $7.7 billion, but investors were still buying.
By October 2012, the rally was clearly over as the on-balance volume (OBV), which had broken to new lows in early 2011 (see chart) had just turned lower after testing its resistance (line a). In a column from November 2012, Don't Step Into the High-Yield Swamp, I pointed out that NLY had dropped 13.5% in the past month and should still be avoided.
The rally in early 2013 just retraced 61.8% of the prior decline before NLY again plunged with the company announcing a dividend cut in June 2013. Once again the OBV, which had warned of the late 2012 drop by breaking support again turned negative in May 2013.
This week the low has been $10.63, which is a decline of 40.6% since the start of 2011. Annaly Capital Management Inc. (NLY) has paid out $5.34 in dividends during this period, which reduces the loss to 10.8%; still not too good when you compare it to the Spyder Trust (SPY) gain of 31% over the same period
NEXT PAGE: Avoid These High Yielders
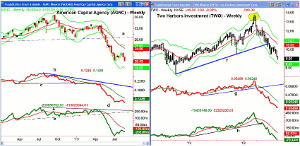
|pagebreak|American Capital Agency Corp. (AGNC) is a $10.9 billion REIT that currently pays a dividend of $4.20 (down from $5.60), which at Monday’s closing price of $20.43 works out to a yield of 19.2%.
- AGNC had a high of $36.77 so it is now down 44% from last year’s high.
- Major chart support, line a, was broken on May 24, and the stock has dropped 26% since the break of support.
- The weekly starc- band is at $18.08, which is the next downside target.
- The relative performance did not confirm the 2012 highs, line b.
- This negative divergence was confirmed when the support at line c, was broken.
- The rally in early 2013 was weak as the RS line stayed below its WMA.
- The weekly OBV also did not confirm the highs (see arrow) and broke support in early May (line e) ahead of prices.
- There is initial resistance at $23.30-$24 with the quarterly pivot at $26.12.
- The second quarter pivot was broken in early May, which was a sign of weakness.
Two Harbors Investment Corp. (TWO) is a residential REIT with a market cap of $3.31 billion that currently yields 13.4%. It trades over seven million shares daily. It has $1.62 billion in cash with a total debt of $15.31 billion.
- The high at $13.70 in March corresponded with the close at the weekly starc+ band, which signaled it was at a high-risk buy level.
- Three weeks after the highs, the stock broke below the prior 12-week lows.
- The uptrend, line f, was not broken until June.
- The relative performance did confirm the price highs and then broke support, line g, in the middle of April.
- The RS is still well below its declining WMA and shows no signs of bottoming.
- The weekly OBV also made a new high with prices but two weeks later dropped below its WMA.
- The break of OBV support, line h, in the middle of April was a bearish sign.
- There is first resistance at $9.60 to $10 with the quarterly pivot at $11.01.
What It Means: These examples reinforce the importance of looking at the risk in any investment, which I felt was going to be a key to success at the start of the year. Unfortunately, when it comes to income investments too few plan an exit strategy before they buy.
Technical analysis is a valuable tool for income investors and should play a key role in all buy decisions.
I was looking for a bit more of a pullback in yields during July but instead a trading range developed before they again surged higher. No market goes straight up or straight down and the yield on the 10-year T-notes may stall once 3.0% is overcome.
How to Profit: No New recommendation


