
Investors drawn to the double-digit yields from mortgage REITs and other instruments commonly overlook some major risk factors…and often wind up paying for it.
The sharp decline in the stock market this week has once again caused ten-year Treasury notes to drop back to the 2% level after reaching a recent high of 2.4%. While the safety of government paper is reassuring, the yield does not keep pace with the inflation rate.
This has caused some investors to turn to mortgage funds, which are generally structured as REITs. As I pointed out on August 4, I am not sure most investors understand the risk involved.
At the October 4 lows, one popular mortgage fund, Annaly Capital Management Inc. (NLY) was down 16% from its August 4 close. As of Tuesday’s close, NLY is now down less than 5%.
On sharp market declines, many of these REITs have very wide ranges, and this makes risk management very difficult. This is another reason I do not favor these REITs, as I have found over the years that for investment success, you must have a plan in place before making an investment.
That is why I always determine a stop level before buying or selling. A look at the price history of several of these REITs will illustrate the pitfalls that investors may face when investing in them.
Click to Enlarge
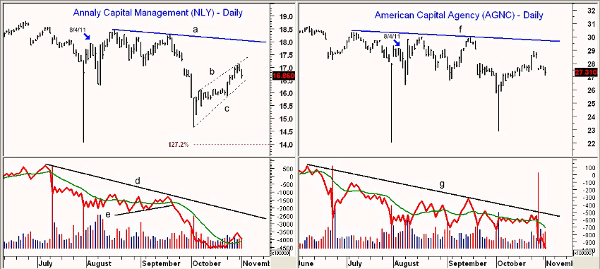
Chart Analysis: Annaly Capital Management Inc. (NLY) is a $14 billion diversified REIT that currently pays a dividend of $2.60. With Tuesday’s close, the yield is 14.4%, and dividends are paid on a quarterly basis.
- NLY has rebounded from the October low at $14.65 and has traced out a bear flag formation, lines b and c
- A break below will confirm that the downtrend has resumed. The flag formation has initial Fibonacci retracement targets in the $14.00 area
- The daily on-balance volume (OBV) formed lower lows during the summer, and the break of support (line e) on September 22 warned of the $2 drop several days in advance
- The daily OBV needs to move through is downtrend, line d, to turn positive
- There is first resistance at $17.50 with the daily downtrend (line a) in the $18 area
American Capital Agency Corp. (AGNC) is a $5 billion REIT that currently pays a dividend of $5.60, which at Tuesday’s closing price of $27.31 works out to a yield of 20.5%. Though AGNC averages over seven million shares per day in volume, the chart looks more like a penny stock, with very wide ranges on July 29 and October 4.
- The daily chart shows a pattern of lower highs, line f, but AGNC has rebounded from the October lows at $22.84. The rally appears to have stalled below $29
- The daily OBV shows a well-established downtrend, line g, that suggests a trend of selling
- Volume was heavy on last week’s down gap
- There is no significant chart pattern to use for downside targets, but I would not be surprised to see a drop below $25
NEXT: More Highly Risky High-Yield Plays
|pagebreak|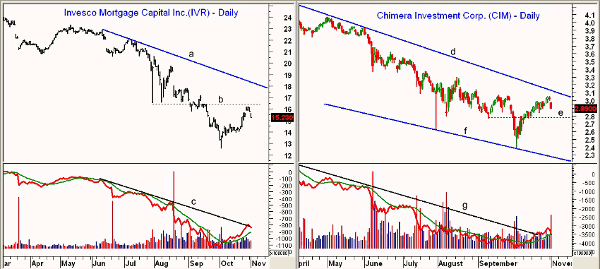
Click to Enlarge
Invesco Mortgage Capital Inc. (IVR) is a $1.4 billion REIT that is scheduled to release earnings on November 3. It pays a dividend of $3.20, which at Tuesday’s closing price of $15.23 is a yield of 21%. IVR made a low of $12.55 in early October.
- The rebound from the October lows appears to have failed just below resistance at $16.40. The daily downtrend, line a, is in the $18.30 area
- The daily OBV has been declining for most of the year and has just tested the downtrend (line c)
- The weekly OBV (not shown) is still negative
- Current support stands at $14-$14.50 and a break of support will suggest a test of the lows
Chimera Investment Corporation (CIM) is a $2.97 billion REIT that pays a dividend of $0.52 for a current yield of 18%. CIM hit a low of $2.38 on October 4. It has rebounded 21.4% from the October lows.
- The rally has reached the resistance from September in the $3.05 area
- The OBV has formed lower lows for most of the year although the break of the downtrend, line g, is not that impressive
- The weekly OBV (not shown) is still below its declining weighted moving average (WMA)
- There is key support now in the $2.75 area. A break of this level would be the first sign that CIM is ready to test its lower support, line f, in the $2.27 area
What It Means: All four of these REITs look negative technically, which suggests they still have significant downside risk. I don’t favor any investment for which I can’t determine an exit price if my analysis is wrong.
For example, if you purchased IVR on the opening January 3 at $21.92, you would have collected $2.77 in dividends so far, reducing your cost to $19.15, but at the current price, it is still down 17.8% for the year. Excluding dividends, CIM is down 28.4% for the year with NLY down 5.8% and AGNC down 3.8%.
Without a clear strategy in place before buying, how low would any of these REITs have to go before you panicked and sold? There appeared to be some panic selling at the recent lows.
For short-term traders, the high volatility makes these REITs attractive watch-list candidates.
How to Profit: If you are holding any of these REITs or other high-yield instruments, have a plan in place now. Determine how much capital loss you are willing to take before exiting.
If you have no exit plan, try to determine how you might feel in a year after collecting the dividends of, say, 17%, but having a capital loss of 20%.


