As we get into the thick of earnings season, MoneyShow’s Tom Aspray selects two stocks set to report in the weeks ahead whose charts display promising patterns.
The cautionary comments persisted over the weekend as some argued that valuations are too high or the bull market is too old. There are many reasons to turn cautious about the stock market at current levels and an increase in bearish sentiment is positive for the stock market.
In the past month the Dow Jones Airlines Index (DJUSAR) is up over 16%, followed closely by the DJ Platinum & Precious Metals (DJUSPT), up 15.4%, while the DJ US Distiller & Vintners (DJUSVN) has gained 14.2%. Many of the stocks in these three industry groups are quite overextended as they are close to their weekly starc+ bands, which makes them high-risk buys.
Overseas markets are trading higher after the long weekend with nice gains in Asia, as well as early in the European session. The stock index futures are showing nice gains in early trading, which is encouraging after last Friday’s mixed close.
Of course, there are still stocks that have not rallied with the market and some are now showing signs that they are being accumulated. In my regular weekly scans, I found these two stocks that have positive volume patterns and appear to have just completed their bottom formations. They will need to see a normal pullback to reach the recommended buy zones.
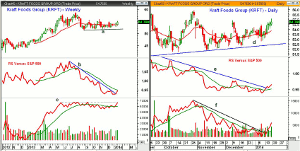
Chart Analysis: Kraft Foods Group, Inc. (KRFT) is a $32.63 billion consumer packaged food and beverage company that has a current yield of 3.74%. It has gained just over 21% in the past year and reports earnings on February 13.
- The weekly chart shows that KRFT has been in a shallow uptrend since last August’s low of $50.69.
- The close last week was above the quarterly pivot at $53.81 with trend line support now at $52 (line a).
- The weekly relative performance broke its downtrend, line b, two weeks ago.
- The RS line is now testing its declining WMA.
- The volume has increased over the past two weeks and the OBV has moved well above its WMA.
- The OBV resistance from last September, line c, is now being tested.
- There is next weekly resistance at $55.93 with the 2013 high about 6.8% higher at $58.76.
The daily chart shows a shallow uptrend, line d, from last October’s lows.
- The rising 20-day EMA is at $53.87 with further support in the $53.50-$53 area.
- The monthly projected pivot support is at $52.50.
- The daily relative performance shows a well-established downtrend, line e, from the highs last July.
- This downtrend was broken last week as the RS line has moved its gradually WMA.
- The downtrend in the daily OBV, line b, has also been broken as it turned up sharply last week.
- The OBV could pullback to its rising WMA as part of the bottoming process.
- The monthly projected pivot resistance at $55.12 was tested last Friday with the daily starc+ band at $55.62.
NEXT PAGE: 1 More Pick to Buy on Pullback
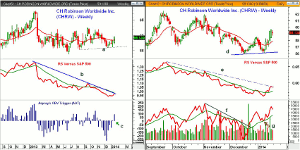
|pagebreak|CH Robinson Worldwide Inc. (CHRW) is an $8.97 billion dollar air delivery and services company that is part of the Dow Transportation Average. It has a current yield of 2.37% and reports earnings on February 4.
- CHRW peaked in early 2013 at $66.68 and was down 6.7% over the past year.
- In early 2014, the December lows at $55.92, line a, were tested.
- CHRW closed last week well above its 20-week EMA and the quarterly pivot at $58.64.
- The relative performance is now testing its downtrend, line b, from the early 2013 highs.
- A close in the weekly RS line above its WMA would be a positive sign.
- The Aspray’s OBV Trigger (AOT) moved above the zero line two weeks ago and improved even more last week.
- The weekly OBV (not shown) needs to close above the October highs to confirm a major bottom.
- There is weekly chart resistance now in the $61.94 to $62.46 area.
The daily chart of CH Robinson Worldwide Inc. (CHRW) shows a potential double bottom formation, line d, as the swing high at $58.55 was overcome on a closing basis last week.
- There is next resistance on the daily chart at $60.65.
- The daily downtrend in the relative performance, line e, has been slightly broken.
- The RS line is well above its WMA, which is starting to turn higher.
- The daily OBV moved through its downtrend, line f, in December consistent with a market that was bottoming out.
- As CHRW was retesting its lows in early December, the daily OBV was just testing its rising WMA.
- The OBV does show a pattern of higher highs, and with the weekly readings, the OBV multiple time frame analysis is positive.
- The late December high is at $58.55 with the 20-day EMA is at $57.85.
What It Means: In yesterday’s column, I recommended taking partial profits on three positions and adjusted the stops on some of the other holdings in the Charts in Play portfolio. It is definitely the type of market environment where one should not be complacent.
From the analysis of the weekly and daily charts of these two stocks, I hope it is clear why I am recommending their purchase at the levels below. If the buy levels are not hit, three days before they report earnings, I would cancel the orders and then re-evaluate their charts.
How to Profit: For Kraft Foods Group, Inc. (KRFT), go 50% long at $54.06 and 50% at $53.32, with a stop at $51.63 (risk of approx. 3.8%).
For CH Robinson Worldwide Inc. (CHRW), go 50% long at $58.22 and 50% at $57.86, with a stop at $55.77 (risk of approx. 3.9%). Cancel if not filled by January 31.


