A year of “Abenomics” has resulted in surging corporate profits and a rising stock market, but after the recent pullback, MoneyShow’s Tom Aspray makes the case for why this should be viewed as a buying opportunity, not a reason to bail.
Thursdays’ nice rebound in the stock market has likely put some bearish traders on edge going into Friday’s job report. If it were not for the jobs report, one would typically expect the rebound to go a bit further and trigger more short covering before the sellers again stepped in to push the market below the recent lows.
The jobs report is likely to short circuit the normal pattern. Though it has not been long since the market made new highs, the decline has already succeeded in reducing both the too high bullish sentiment and the market’s overbought status.
In the latest numbers from AAII, only 27.9% of individual investors are now bullish, a drop of over 28% in just six weeks. Many stocks and sectors have already reached the first good support levels and some, like the homebuilders, have had the burst of upside momentum needed to turn their outlook positive.
The positive action ahead of the jobs report carried over to Asia as Japan’s Nikkei 225 closed up well over 2% on Friday. Still it has not even filled the gap from Tuesday’s sharply lower opening. The NK225 is still down 11.4% from the late December high of 16,320.
The recent strengthening in the yen has added to the selling pressure for Japanese stocks as nervous investors are bailing out of their long positions. Both the fundamental and technical evidence, however, suggests that the decline in the Japanese market is creating a buying opportunity.
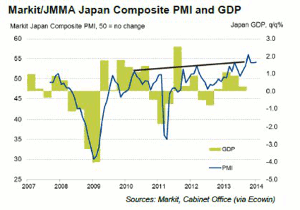
The chart of the Markit/JMMA Japan Composite PMI shows the breakout above long-term resistance in 2013, line a, which is a positive for their economy. The uptrend in their manufacturing output index shows an even more powerful uptrend; all of which bodes well for continuing improvement in their economy.
A technical look at the yen and a leading Japan-focused ETF suggest that investors should be looking to buy, not sell, the Japanese shares.
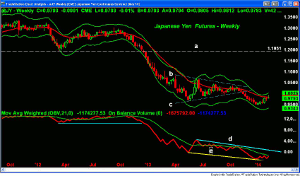
Chart Analysis: The long-term chart of the Japanese yen shows the break of major support, line a, in December 2012. Therefore, anyone who had bought the yen over the prior 2½ years was now in the red.
- The yen future had a high of 1.3368 in November 2011 and is now down over 26% from its high.
- In 2013, the yen formed a flag or continuation pattern (lines b and c), which was completed in November as the bull trap in gold was also closing.
- The chart formation has downside targets in the 0.8700 area.
- This week’s push above the 20-week EMA and lower close could be a sign that the yen’s rebound is already losing upside momentum.
- The on-balance volume (OBV) confirmed the completion of the top formation in 2012 by also breaking support.
- The OBV has formed lower lows, line e, and is still below it declining WMA.
- This is consistent with an oversold rally that will be followed by further new lows in the yen.
NEXT PAGE: A Japan-Focused ETF to Watch
|pagebreak|The WisdomTree Japan Hedged Equity (DXJ) has a yield of 1.29% with an expense ratio of 0.48%. The ETF hedges its yen exposure and has holdings in 312 different Japanese stocks with 35% in the top ten holdings.
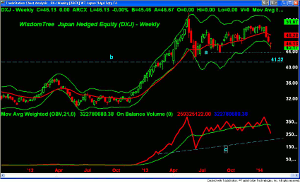
- The chart shows that it had a high of $50.84 on the last day of 2013 and reached a low of $44.66 on Tuesday.
- From high to low, this was a drop of 12.1% as DXJ dropped below the weekly and daily starc- bands.
- There is next support at $43.75 with support from 2011 at $41.32 (line b) and the monthly starc- band at $39.79.
- The weekly OBV tested the April highs at the end of the year but has since dropped below its WMA.
- The OBV has next strong support at line c.
- The daily OBV (not shown) has turned up but is still below its declining WMA.
- There is initial resistance now in the $47-$47.75 area and the monthly pivot.
What It Means: It is possible that Tuesday’s lows will not be exceeded on this correction, and if so, it will make a good risk/reward entry more difficult. If instead we get a drop to or below these lows, then it should provide a better risk-buying opportunity. Those who are already in the Japanese market should stay with their positions.
As I noted yesterday, I think that the global correction in the equity markets will also provide a good buying opportunity in the Vanguard FTSE Europe (VGK), the Wisdom Tree Europe Small-Cap Dividend (DFE), and the iShares MSCI Spain (EWP).
Alternatively, I will look for some daily buy signals in the WisdomTree Japan Hedged Equity (DXJ), as well as other Japan-focused ETFs.
How to Profit: For WisdomTree Japan Hedged Equity (DXJ), go 50% long at $45.06 and 50% long at $44.34, with a stop at $42.74 (risk of approx. 4%).
Editor’s Note: If you’d like to learn more about technical analysis, attend Tom Aspray’s workshop at The Trader’s Expo New York, February 16-18, 2014. You can sign up here, it’s free.


