These examples show the power and accuracy of Bollinger bands as a trend indicator perhaps best used to confirm or validate trade ideas in all markets and time frames.
John Bollinger delivered a terrific keynote address this past weekend at the Futures & Forex Expo. Watch the keynote address here.
(If you didn’t make it to that event, you cannot miss the Las Vegas Traders Expo this November. It’s the absolute best place to talk trading strategy with fellow traders from around the country. You’ll learn more in four days that you have all year. Do yourself and your trading account a favor and register now to attend.)
It got us thinking about how we use Bollinger bands in our own daily analysis. At Online Trading Academy, we focus on price action as our most important indication as to when and where to take trades. Even though price is the most critical part, we still can (and do) use some technical indicators to assist in our trading decisions. One such indicator that is very useful and versatile is the Bollinger band.
Bollinger bands are created by drawing a line two standard deviations from a moving average. The theory behind this is that price is elastic; it will often stretch away from the average to extremes and then snap back to that average.
Deviation of price tells us how far prices should move away from that average and is a function of volatility. Two standard deviations should include roughly 96% of all closings. If we do close outside of that line, we are unlikely to continue to do so without retracing back to the average first.
See related: Bollinger Discusses Bollinger Bands
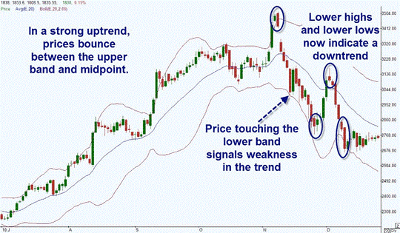
A simple use of the Bollinger bands is as a trend indicator. In an uptrend, the price will move between the midpoint of the bands, which happens to be the 20-period exponential moving average (EMA) and the upper band.
If the trend is strong, you will see this occurring. You would have an opportunity to buy into the strong trend when prices retrace back to the 20-period EMA and a demand level. Your target would be supply and a touch of the upper band.
Weakness in the trend would be signaled by the first touch of the bottom band. While this does not initially signal the end of the bullish move, it is a warning that the end may be near.
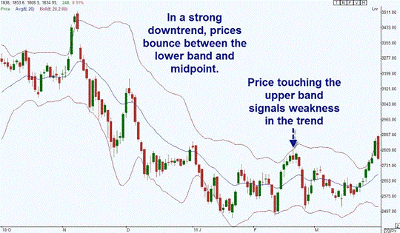
If the trend is to turn negative, you will first notice lower highs and lower lows. Should the downtrend become strong, then price will bounce between the 20-period EMA and the lower band.
Once again, a sign of weakness of the bearish trend would be a touch of the upper band. This does not necessarily mean a reversal is coming, but it does offer a signal to be cautious in continuing to short the markets.
Remember to focus on supply and demand to anchor your trading decisions. Use technical tools as they are intended to be used. They are decision-support tools that offer a different perspective on price action. Always trade with the highest probability and with managed risk.
By Brandon Wendell of Online Trading Academy


