Bulls and bears could both be right this coming week, but you can count on continued high volatility, and for well-selected stocks to look more attractive than ETFs. MoneyShow’s Tom Aspray highlights a few of the stock gems he’s found at this crucial point of the year.
It was a rollercoaster ride in many of the markets last week, especially stocks. However, after a very negative close Monday in reaction to the turmoil in Italy, stocks did manage to rebound and close the week a bit higher.
This volatile movement did little to resolve what seems to a debate between the bulls and bears on Wall Street that has been going on the for the past few weeks leading up to Friday’s sequestration deadline. The question most investors are asking is, how will stocks do in March? Also, should they be buying or selling? As discussed in late January, the seasonal pattern is for stocks to correct for most of January before starting to turn higher in the first week of March. Since 1950, the S&P 500 has closed higher in March 40 times and lower 23 times. In 2009, the S&P was up over 9%, which is the best year, while 1980 was the worst with a decline of over 10%.
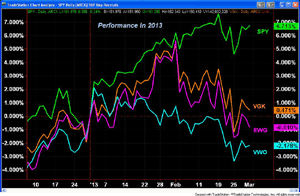
One of the key concerns from the bearish camp is that we have already had a great year in the stock market, so what more can one expect? The comparison chart shows that the Spyder Trust (SPY) is currently up around 6.8% in 2013, which is not bad for two months.
Many may be surprised at what has transpired in many of the other world markets. As I discussed last week, many overseas markets topped out at the end of January.
- The iShares MSCI Germany Index (EWG) is now down 1.2% for the year, for instance, after being up 6% just over a month ago.
- The Vanguard MSCI Europe (VGK) is up just 0.5% for the year.
- The Vanguard FTSE Emerging Markets ETF (VWO) is now down 2% in 2013.
Many of the world markets do show typical corrective patterns. When they are completed, it is likely to be a positive sign for the US markets.
In looking at many of the individual stocks, similar divergences are evident. The Dow Industrials did the best in February, and the technical evidence confirms last week’s view that it was taking over a leadership role.
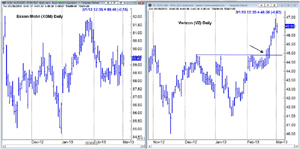
The chart of Exxon Mobil (XOM) shows that it peaked at $91.93, with a recent low of $87.70, which was a 4.6% decline from the high. Then you have stocks like Verizon Communications (VZ), which broke through resistance on February 20 and has rallied over 4%. This type of divergence makes stock selection critical. It especially makes investing in ETFs geared to a particular market segment or average less rewarding.
NEXT: What to Watch
|pagebreak|
The Eurozone is likely to have a further impact on the day-to-day gyrations in the global equity markets. Data out of the Eurozone Friday indicated that inflation had dropped while unemployment had risen; 19 million are now unemployed. This will put further pressure on the ECB to lower rates, maybe as soon as this week.
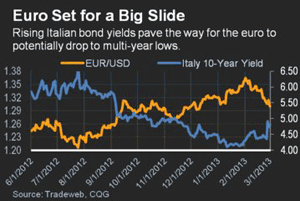
The concern over the value of Italian bonds has many Eurozone bankers on edge, as they have large holdings in these bonds. The chart shows that Italian bond yields appear to have bottomed at 4%, and are now edging higher as their prices have declined.
Of course, lowering rates would also weaken the euro, and could eventually push it back to last summer’s lows in the $1.20 area.
There are also some positive signs, though. Sentiment toward the economy has improved, and some of the Eurozone stock markets still have positive weekly technical patterns. Most of the news on the US economy was quite good last week. Consumer confidence saw a sharp ten-point improvement from last month, and the ISM Manufacturing Index was strong on Friday. Manufacturing also picked up in both the Chicago and Richmond areas. It was a bit weaker in Dallas. The housing data was also strong as the S&P Case-Shillar Housing Price index showed a nice increase as both New home Sales and Pending home sales beat economist’s estimates. The GDP and Durable Goods data were both disappointing. On Tuesday, we get the ISM Non-Manufacturing Index, followed on Wednesday by the ADP Employment Report and factory orders. In addition to the weekly jobless claims, we also get the latest report on international trade on Thursday, along with productivity and costs. Then on Friday, we get the monthly employment report, which bond traders will be watching closely.
What to Watch
Discerning the short-term direction of stocks has been tough over the past week or so.
Last Monday’s drop took the major A/D lines below their prior lows, which generally means a deeper correction. However, Tuesday’s sharp rally brought the A/D lines back above their previous highs, which flipped the short-term outlook back to positive. This week, I would look for more choppy action, with the potential for one more good downdraft before the correction is over. It is also possible that the major averages will see little upward progress in March, but I expect quite a few stocks to do much better. The traders that are interviewed regularly on the financial networks remain skeptical, if not downright bearish on the market. It would likely take a move to new highs in the S&P 500 before they changed their tunes. The sentiment numbers improved last week. Only 28.3% of those surveyed by the AAII are now bullish. This number stood at 52.3% in January. The failure to resolve the sequestration could turn them even more negative this week. The financial newsletter writers also have turned more cautious: 46.3% are bullish, down from 54.7% a month ago.
NEXT: Stocks and Tom’s Outlook
|pagebreak|
The technical evidence now favors buying stocks that are outperforming the major averages. To find these, I typically look at the weekly and daily relative performance analysis, as well as the volume and chart patterns.
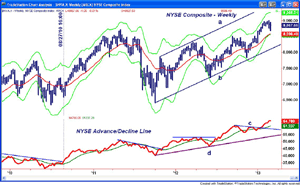
Last week, I pointed out two Dow stocks that I thought had turned the corner, International Business Machines (IBM) and McDonald's Corporation (MCD). So far, only IBM has reached my initial buy level. I will likely favor large caps given the recent leadership of the Dow Industrials, but I will also look for mid- and small-cap stocks if the risk can be controlled. The long-term weekly chart of the NYSE Composite shows the recent high of 9,004. Up to Tuesday’s early low, it had dropped 3.3%. It has held well above the 20-week EMA at 8,596, as well as the stronger support from last September at 8,515.
There is initial resistance now at 8,947, which was last Monday’s high. The next major resistance from 2008 is in the 9,400 area, followed by 9,724. The all-time high from October 2007 stands at 10,311<
The weekly NYSE Advance/Decline line broke out to the upside in January as the resistance (line c) was overcome. It has continued to make new highs, and shows no signs yet of a top. On the chart, you will notice that in the past, similar breakouts corresponded with rallies that lasted more than just a month or two, and the A/D line typically warns in advance of a deeper correction.
S&P 500
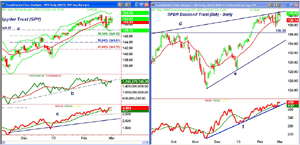
The Spyder Trust (SPY) has traded between $153.28 and $148.73 over the past two weeks. So far, the correction has held above the stronger support at $148.15, but did come close to the daily Starc- band early last week.
The daily on-balance volume (OBV) broke its uptrend on February 21, and is now very close to moving back above its WMA. The weekly OBV (not shown) is acting much stronger, having held well above its rising WMA. The S&P 500 A/D line has crossed its WMA four times in the past week or so, but is now very close to making new highs. The decline held above the stronger support (line c). A daily close above $152.87 to $153.28 should be enough to confirm the correction is over. The all-time highs are not far away at $157.42.
Dow Industrials
The SPDR Diamond Trust (DIA) has been holding up well after its one sharp down day, as it is still bumping into the resistance (line d) that goes back to the 2012 highs. It made a new weekly closing high this week, even though it has not surpassed the all-time high of $141.95 . The highest daily close was at $141.57, which occurred on October 9, 2007.
The Dow Industrials A/D line closed the week at new rally highs last week after testing tis uptrend (line f) last week. The weekly relative performance (not shown) with this week’s strong close now appears to have completed its bottom formation.
NEXT: Sector Focus and Tom’s Outlook
|pagebreak|
Nasdaq-100
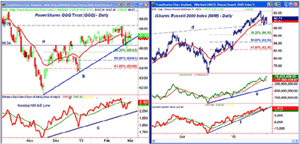
The PowerShares QQQ Trust (QQQ) reached a low last week of $65.96, which was just below the quarterly pivot support at $66.10. It held above the 38.2% Fibonacci support at $65.63.
The uptrend (line b) appears to be holding, but a close above $68.35 is needed to signal that the Nasdaq-100 is finally ready to catch up with the rest of the market. The Nasdaq-100 A/D line has moved back above its WMA, but is still below its previous high. It has also not surpassed the high from last summer.
Russell 2000
The iShares Russell 2000 Index (IWM) may have completed its correction last Friday, as it dropped down to test the week’s lows and support (line d) before closing higher. The decline has held above the monthly pivot support at $87.
There is initial resistance now at $91.57, followed by $92.68, which was the February 20 high. For this week, the Starc+ band is at $95.49, with the quarterly R2 resistance at $97.69.v The daily OBV tested its rising WMA last week, but made new highs on Friday. The Russell 2000 A/D line dropped below its WMA and its uptrend (line f) on the correction. It now appears to have resumed its uptrend, but is still below its February highs.
Sector Focus
It is not a surprise that the iShares Dow Jones Transportation (IYT) made another new high in the past week, after correcting as low as $103.03. That was a correction of over 3.8%, but most of the damage occurred in just two days. Following a new high on Thursday and IYT closed the week with a 0.7% gain.
The Select Sector SPDR Financials (XLF) and the Select Sector SPDR Energy (XLE) were the weakest sectors last week, down 0.5% and 0.7%. XLE may have already completed its correction, and if it retests the lows it will look attractive.
NEXT: Commodities and Tom’s Outlook
|pagebreak|
The two best performers were the Select Sector SPDR Consumer Discretionary (XLY) and the Select Sector SPDR Health Care (XLV), which were two of the Best Sector Bets for the New Year.
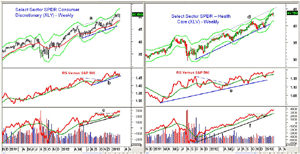
The Select Sector SPDR Consumer Discretionary (XLY) held in a tight range during the market correction, testing the breakout level (line a). It is now very close to making new highs for the year. The weekly Starc+ band is at $53.50. The relative performance confirmed the highs early in the year, and the RS line has just moved back above its WMA. The OBV staged another upside breakout early in the year (line c), and is acting stronger than prices.
The Select Sector SPDR Health Care (XLV) did make a new high for the year last week at $43.78, and continues to act very strong technically. The weekly Starc+ band and the upper boundary of its trading range (line d) are now in the $45.20 area.
The RS line held above its WMA on the correction, making new highs this week. The OBV looks even stronger than it did for XLY, as it is rising sharply. The defensive Select Sector SPDR Utilities (XLU) was up 0.7%, while the Select Sector SPDR Consumer Staples (XLP) were down slightly.
Crude Oil
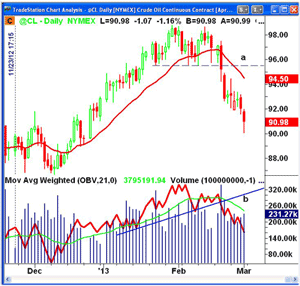
The selling in crude oil has continued this week. Since crude often leads the stock market, this is a concern. After completing the double top formation when it broke support at $95.53 (line a), it has plunged to the $90 level.
The OBV broke its support, and is well below its declining WMA, but overall the market is acting oversold. The strength of any rally will be important.
Precious Metals
Trading in the metals recently has been crazy, as I discussed Friday in The Wild World of Gold & Silver. Sharp rallies have been followed by equally sharp declines. The weekly and daily technical outlook for gold, silver, and the gold miners is negative, and I would not be bargain hunting yet. There will be a time later this year...but there are no signs that the current selling is over.
The Week Ahead
The volatility certainly picked up last week, but I doubt it will be as wild this week. The decline in some of the averages and many of the stocks has been enough to relieve the market’s overbought status.
The worst of the selling may now be over, but the wide ranges in the averages makes them less attractive than individual stocks. Our core holdings in the health care, consumer discretionary, and financial ETFs continue to do well, but for new buying stocks look best. Once it is clear that the correction is over, it will be a good time to adjust the stops on your positions to under the recent lows. If you have participated in gains this year, it will be easier to do new buying. For those who have not been in the market, I will try to find some more conservative plays in the weeks ahead.
- Don't forget to read Tom's latest Trading Lesson, 5 Rules for Success in 2013

