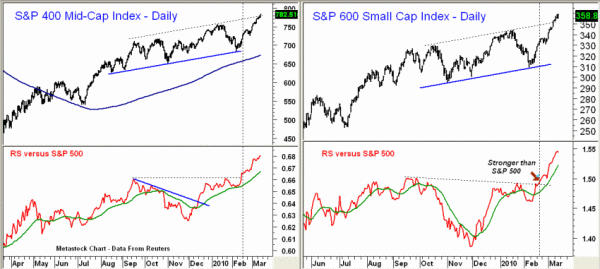
Both the S&P 400 (mid-caps) and the S&P 600 (small caps) have moved above their upper trading channels. The RS for the S&P 400 broke out to the upside on February 16, and it is now up 12.5% from the February lows and continues to look strong. Next major resistance is in the 800-824 area. The S&P 600 has been even stronger, up 16% from the lows versus just 10% in the S&P 500. The RS line shows no signs yet of topping out with strong chart resistance in the 400 area.
STRATEGIES
Small Caps Still Leading
03/12/2010 9:36 am EST•1 min read

Top Pros’ Top Picks (Daily)
Subscribe to MoneyShow’s daily investment newsletter Top Pros' Top Picks and get actionable advice from our top experts, including the hottest stocks to buy and sell, ETFs and funds for short- and long-term capital appreciation, and a wide variety of dividend-paying stocks set to deliver a steady stream of safe, reliable income.

Trading Insights (3x/Week)
Get an edge on the markets with our three-times-a-week trading newsletter, Trading Insights. Receive timely trade ideas covering stocks, options, futures, and more to keep you on the right side of the action. From trading basics to advanced strategies and high-probability set-ups, the insights you need from our all-star lineup of trading pros is delivered straight to your inbox.
Trending Now
Filter By Category
Filter By Keywords
Loading...


