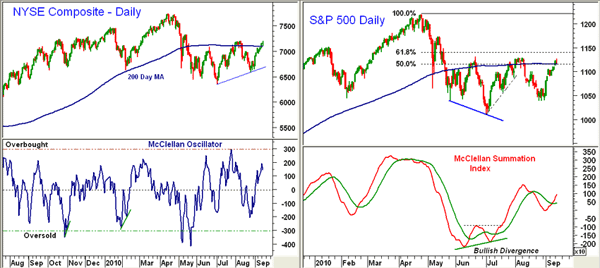
The NYSE Composite and S&P 500 closed above their 200-day moving averages (MAs) for the second day in a row. Last week, I noted that the NYSE A/D line was forecasting higher prices. Some other measures of the market’s internal health also look good. The McClellan Oscillator, a short-term advance/decline indicator, has moved well above the zero line but is still below overbought levels. It suggests the rally can go further. The Summation Index is an intermediate-term indicator that has risen above its 21-period weighted moving average (WMA), and it would take several days of very weak numbers to reverse.
Tom Aspray, professional trader and analyst, serves as video content editor for MoneyShow.com. The views expressed here are his own.


