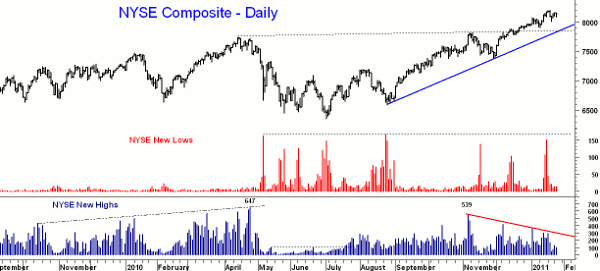
Chart Analysis: As the stock market continues to move higher from the August 2010 lows, there are some early signs of increased investor interest in stocks. This is a welcome sign, as over the past few years, bonds have been favored. This changed in mid-November as money started to exit the bond market. As for timing, is this a good time for investors to be shifting their 401(k)s back into stocks?
One method I have used for many years to monitor the stock market’s internal health is to watch the number of stocks making new highs and new lows on the NYSE. In a strong market, you want the number of new highs to increase and make higher highs with the major averages. In a down market, you watch the number of stocks making new lows, because as long as this number is increasing, the downtrend is likely intact. Here is what you need to know:
- The number of new highs expanded through 2009 and 2010, peaking at 649 in April 2010
- The number of stocks making new highs started to expand late in the summer, which was positive
- The number of new highs peaked in November 2010 at 539, below the April peak
- The new highs are now in a downtrend as the new highs have failed to exceed the April 2010 peak
- The number of new lows hit 161 on the flash crash in May and stayed at relatively high levels during the summer
- Over the past three months, the number of new highs has often been over 100, which did not happen during the rally to the April 2010 highs
- This suggests that the market is not as strong now as it was in 2010
- An increase in the new lows to over 165 would be a short-term negative
What It Means: As regular readers are aware, the NYSE Advance/Decline (A/D) line is my main gauge of the market’s health as it kept me bullish on the intermediate trend during the summer months. It has recently made new highs, confirming that the major trend is still positive. Still, the failure of the new highs to confirm the market action increases the odds of a sharp correction.
How to Profit: Much has changed since late-August 2010 when less than 30% of newsletter writers were bullish, and the independent investors were also decidedly bearish, with AAII sentiment numbers revealing only 20% were bullish. Recently, 56% of the newsletter writers and over 50% of AAII members were bullish.
The analysis of the new high/low data and of the sentiment readings suggests that those who are not invested in stocks are very likely to get a better entry point over the next three to five weeks. Watch for an increase in the new lows to above 165 to indicate that a correction is underway.
Tom Aspray, professional trader and analyst, serves as senior editor for MoneyShow.com. The views expressed here are his own.


