While the overall market struggles, railroad stocks are an attractive area for new buying, and risk-controlled entry points are being presented in three of the industry’s strongest stocks.
The major averages spent the month of May declining and the selling picked up in June. In contrast, the S&P Railroads index made a closing high of 733 on May 10 and retested these highs at the end of May. So far in 2011, the index is up over 10% versus just 1.6% for the S&P 500.
The railroads are an economically sensitive industry, and of course, they did suffer during the recession. The Transportation sector has been a market leader since the March 2009 lows, and during the recent correction, the railroad stocks have held up better than the overall market.
Of the three railroad stocks that look the best technically, two of them—Union Pacific Corp. (UNP) and Norfolk Southern Corp. (NSC)—also yield over 2%, while the third, CSX Corp. (CSX), yields less than 1%. Of course, it is more important that all three appear to have completed their corrections and have positive relative performance, or RS analysis.
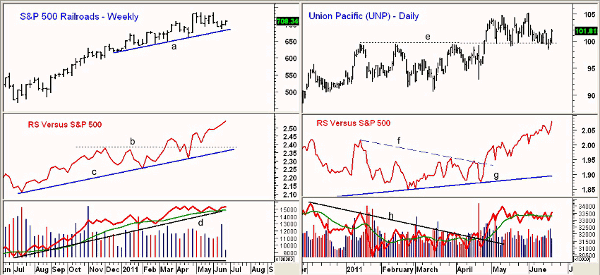
Chart Analysis: The weekly chart of the S&P Railroad index shows that the uptrend that goes back to early in the year (line a) was tested last week and Monday’s action was positive. There is initial support at 684 with further support in the 660 area.
- The relative performance, or RS, broke through resistance, line b, in April before pulling back to test the longer-term uptrend, line c
- The RS has been making new highs over the past month, reflecting the group’s better relative performance than the S&P 500
- The weekly on-balance volume (OBV) has also turned up from its long-term uptrend, line d, and is back above its weighted moving average (WMA). The daily OBV (not shown) is also positive
- Once above the all-time highs at 734, the next upside targets are in the 750 area, or about 6% above current levels
The daily chart of Union Pacific Corp. (UNP) shows the retest of May’s breakout level (line e) in the $99.60 area, which is a classic technical formation. While the S&P 500 is still down 6.1% from the May 2 closing high, UNP is only down 1%.
- Once above the recent highs at $104.77, the next Fibonacci targets are in the $107.20 area. The weekly Starc+ band and the next upside targets are in the $109-$110 area
- The RS analysis confirmed the upside breakout, as its resistance, line f, was also overcome. The RS has formed higher lows, line g
- Volume was also good in late April and early May, as the downtrend in the OBV, line h, was overcome
- There is additional support for UNP in the $96-$97 area with the March lows at $90.66
NEXT: Two More Railroads That Are Really Rolling
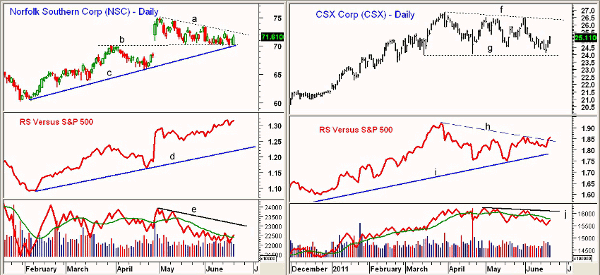
|pagebreak|Norfolk Southern Corp. (NSC) shows a tight trading range since peaking at $75 in April. Over the past few days, the converging support (lines b and c) in the $69.50-$70.50 area has been tested.
- This also corresponds to the 38.2% retracement support with the 50% level at $67.80
- The RS made new highs last week and is well above the breakout level from May. The long-term uptrend in the RS (line d) is positive
- The daily OBV is still well below its resistance at line e, but it has moved back above its weighted moving average. The weekly volume (not shown) did confirm the April highs and is above its WMA.
- On a close above $72.60, the next chart and Fibonacci targets are in the $76.50-$77 area
CSX Corp. (CSX) has been in a broad trading range (lines f and g) over the past three months. Last Thursday, the support at line g in the $24 area was tested, as the low was $24.08.
- The low for CSX last summer was at $15.58, so the 38.2% retracement support is at $22.50
- The RS has just broken out to the upside, as the resistance, line h, has been overcome. The uptrend in the RS (line i) goes back to last summer’s lows
- The daily OBV has turned up from its support, line k, but it is still below its weighted moving average and resistance at line i
- The weekly OBV (not shown) did confirm the price highs in April
- The resistance is now strong in the $26.40-$26.80 area with the 127.2% retracement target at $27.60, which also corresponds to the weekly Starc+ band
What It Means: The intermediate-term technical picture for the stock market still indicates that the market did not complete a major top in May. It is possible that last week’s lows marked the end of the correction, but so far, we do not have confirmation.
A weekly close above last week’s highs would be positive. A resumption of the stock market’s uptrend implies an improvement in the economic numbers. This would be positive for the transportation sector and the railroads in particular.
How to Profit: For those who are underinvested in the stock market, the railroads look to be an attractive area for new buying. The technical action for one of the most liquid transportation ETFs, the iShares Dow Jones Transportation Average Index Fund (IYT) has not yet given new buy signals.
Union Pacific Corp. (UNP): Go long at $101.06 with a stop at $95.62 (risk of approx. 5.4%). Sell half the position at $106.80 and raise the stop on the remaining position to $102.74.
Norfolk Southern Corp. (NSC): Go long at $71.31 with a stop at $67.66 (risk of approx. 5.1%). Sell half the position at $76.20 and raise the stop on the remaining position to $69.56.
CSX Corp. (CSX): Go long at $24.96 with a stop at $23.78 (risk of approx. 4.7%). Sell half the position at $27.32 and raise the stop on the remaining position to $24.56.


