
The usual summertime correction in oil prices is now setting up risk-controlled buying opportunities for several strong oil-services stocks and a primary sector ETF.
The stock market’s celebration over the apparent debt-ceiling resolution was short lived, as a much-weaker-than-expected manufacturing report doused the rally with cold water. Though the stock market is oversold, the failure to mount a better rally suggests a drop to the March lows may happen sooner rather than later. The good news is that the increasing negativity may mute any reaction to a worse-than-expected job report on Friday.
The doubts swirling over the economic recovery have also put additional pressure on crude oil prices, as evidenced by the recent failure to overcome chart and trend line resistance last week. A drop back to the $90 area is now likely.
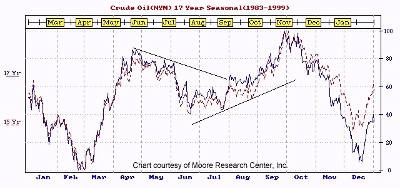
Click to Enlarge
This chart from the Moore Research Center, Inc does indicate a low for crude oil prices during the summer months. It supports my technical view that the current decline in crude oil should be a buying opportunity. I have added my own trend lines to the chart to highlight my observation that the downtrend in crude oil prices from the April-to-May highs is typically overcome in early August.
Technically, the energy sector topped in May (see “Big Oil’s Big Top”), but one energy group that has bucked the trend has been the oil services and equipment stocks. With the overall market weakness, these stocks are also currently correcting, but that is likely to set up a good buying opportunity at lower levels.
NEXT: The Best Buys in Oil Services This Summer
|pagebreak|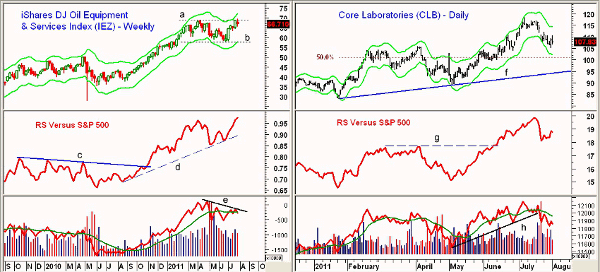
Click to Enlarge
Chart Analysis: The iShares Dow Jones Oil Equipment & Services Index Fund (IEZ) is less liquid than the Merrill Lynch Oil Service HOLDRS Trust (OIH) but holds a greater number of oil-service stocks. There was an impressive flow of funds into IEZ in late July, just as the fund was approaching its weekly Starc+ band.
- The weekly chart shows resistance at $69 with major resistance from 2008 in the $72-$75.40 area
- The weekly relative performance, or RS analysis, looks very strong, as it has surged to new highs and is acting stronger than prices. It tested its uptrend, line d, earlier in the summer
- The RS broke through resistance, line c, last November
- The weekly on-balance volume (OBV) has formed lower highs (line e) and looks ready to drop back below its weighted moving average (WMA). The daily OBV also suggests a further pullback
- There is first support at $63.40 with more important support in the $57.80 area, line b
Core Laboratories (CLB) peaked at $118.50 in the first week of July, testing both the weekly and daily Starc+ bands.
- CLB has now reached first support in the $105 area with the 50% retracement support (from the 2011 lows) at $101. There is trend line support at $95, line f
- Despite the pullback, the daily RS analysis still looks positive, as it broke through resistance, line g, in June. It has just tested its uptrend and did confirm the recent highs
- The daily OBV broke its uptrend, line h, several weeks ago and is still declining. The weekly OBV (not shown) also confirmed the recent highs
NEXT: Risk-Controlled Entry Points for Buying These Equities
|pagebreak|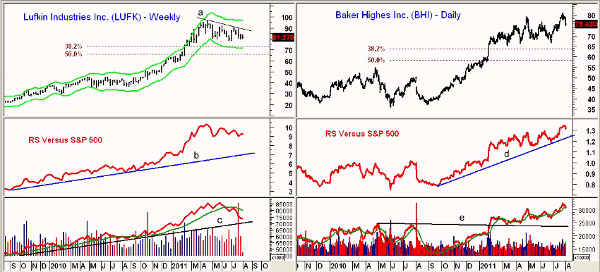
Click to Enlarge
Lufkin Industries, Inc. (LUFK) is likely a lesser-known oil services and equipment stock that is still declining from the April highs at $97.05. The weekly chart shows a pretty normal corrective pattern.
- The initial support is at $77.67 with stronger support in the $75 area
- The major 38.2% support from the 2010 lows is at $73.40 with the weekly Starc- band at $71.50. The more important 50% support level is at $66
- The weekly RS analysis is holding up quite well, as it is in a very narrow range and is well above its long-term uptrend, line b. It did confirm the April highs
- The weekly OBV dropped below its weighted moving average in mid-June and is now reaching good support at line c
- There is initial resistance at $83.40 with key weekly resistance in the $90.80-$92 area, line a
Baker Hughes, Inc. (BHI) reported earnings before the open on Tuesday and revenues jumped 41%, which easily beat analyst estimates. The company’s overseas operations contributed significantly to the very positive numbers.
- BHI has recently corrected from the highs at $80.99, but the new earnings report should stabilize prices. BHI has its weekly Starc+ band now at $84
- The daily Relative Strength Index (RSI) is still in a solid uptrend, line d, and just recently made new highs. The weekly analysis also looks strong
- The daily OBV has just tested its rising weighted moving average and the weekly OBV (not shown) also confirmed the recent highs
- There is next support for BHI at $72.50 with stronger support at $66.50 and the weekly Starc- band. The 38.2% retracement support form the 2010 lows is at $63.75
What It Means: The seasonal pattern appears to coincide nicely with the correction in many of the oil service stocks and in sector ETF IEZ. Given the overall market weakness, taking a new position is more hazardous. Baker Hughes, Inc. (BHI) is one of the leading stocks in this group, but do not chase it following the very bullish news, because it will eventually correct.
For the other two stocks and IEZ, look to buy on a drop to stronger support where the risk can be well defined.
How to Profit: Buy the iShares Dow Jones Oil Equipment & Services Index Fund (IEZ) at $62.04 with a stop at $57.77 (risk of approx. 6.8%).
Buy Core Laboratories (CLB) at $103.22 with a stop at $99.66 (risk of approx. 3.4%).
Buy Lufkin Industries, Inc. (LUFK) at $75.40 with a stop at $71.64 (risk of approx. 4.9%).


