
If the broad market finds a near-term bottom, the semiconductor sector should also rebound, and a leveraged chip sector ETF has significant upside for a quick short-term buy.
The strong action in the US stock market on Tuesday came as a surprise, as there was little bullish news that the financial press could use to explain the price action. The prevailing opinion seems to be that the further signs of a weakening economy will spur Fed Chairman Ben Bernanke to say something dramatic on Friday.
Of course, from a technical perspective, any news is a distraction because if it is significant, the market usually reflects it well in advance. There has been some short-term technical improvement with Tuesday’s close, and it suggests that we should see at least a test of last week’s highs, if not a rally to stronger resistance over the near term. To support this view, the major averages will need to surpass Tuesday’s highs either Wednesday or Thursday.
The semiconductor sector has been especially weak since the May highs, and the combined analysis of a leveraged long and short semiconductor ETF suggests a potential contra-trend trading opportunity.
Click to Enlarge
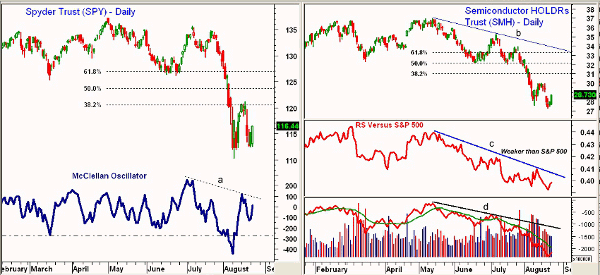
Chart Analysis: The chart of the Spyder Trust (SPY) shows last Friday’s close at $112.64, which was just above the prior closing lows of $112.26 and $112.29. There is initial resistance at $118.21-$121.20, which was last week’s high.
- The 50% Fibonacci retracement resistance from the early-May highs is at $123.68 with the 61.8% resistance at $126.87
- Calculating from the early-July high, the 50% retracement resistance is at $122.93
- The McClellan Oscillator shows a positive short-term formation, as it dropped from +116 to -129 before turning higher Tuesday. It is now back above the zero line and a move above resistance at line a would signal a further rally
- SPY has short-term support at $115-$115.25 with stronger support in the $114.30-$114.50 area
The Semiconductor HOLDRs Trust (SMH) closed up 3.8% Tuesday on average volume with next strong resistance at $29-$30. The 38.2% retracement resistance is at $31.
- The more important 50% retracement resistance is at $32.12 with the downtrend (line b) at $33.80
- The relative performance, or RS analysis, has indicated that SMH would be weaker than the S&P 500 since May, as it has been in a downtrend, line c
- Through last week’s lows, SMH had dropped over 26% from the May highs, much worse than the S&P 500
- The daily OBV has started to form lower lows in June, and the downtrend (line d) is still intact
- There is initial support now at $27.30-$28
NEXT: Top Semiconductor ETFs for Short-Term Trading
|pagebreak|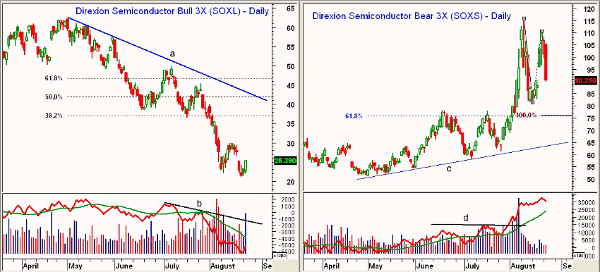
Click to Enlarge
The Direxion Daily Semiconductor Bull 3X Shares (SOXL) was up 15.3% Tuesday on the highest volume in over two weeks. There is first resistance at $26.76 with stronger resistance at $29.86.
- The 38.2% retracement resistance is at $37 with the 50% resistance level and the downtrend, line a, in the $42-$42.80 area
- The on-balance volume (OBV) has turned up but is still well below its declining weighted moving average (WMA) and its downtrend, line b
- There is minor support now at $24.20-$24.50 with stronger support in the $22.90-$23.40 area
The daily chart of the Direxion Semiconductor Bear 3X Shares (SOXS) shows a sharp reversal Tuesday, as it was down 15.6%. Using the decline from the August 9 high to the August 15 low, there are some interesting Fibonacci targets.
- If the current decline is equal to this prior decline, then measuring down from last week’s high gives you a Fibonacci target at $76.50, which also corresponds to the 61.8% retracement support level
- There is short-term support now at $88 and extending down to the $83 level
- The daily OBV is still clearly positive, as it is acting stronger than prices, and is well above its rising weighted moving average. Volume was not heavy on the decline
- The OBV broke through resistance, line d, ahead of prices in late August
- SOXS has initial resistance at $100 with stronger resistance in the $105 area
What It Means: The short-term action of the McClellan Oscillator suggests that a short-term market low is in place. To abort the bottoming formation, it would take a drop below the lows of the past three days in several of the major index ETFs and the 1111-1123 level in the September S&P 500 e-mini futures. The futures were down almost ten points an hour before Wednesday’s opening.
On a further rally, the initial target for the Spyder Trust (SPY) is $121.20, and I would not be surprised to see a rally to the $122.93-$123.68 area.
At this point, the technical evidence suggests a move back to and possibly above last week’s highs before the rebound from the August 9 lows is over.
How to Profit: There are no signs yet that the Semiconductor HOLDRs Trust (SMH) or the semiconductor industry group is bottoming, as the RS analysis is still negative.
However, if a short-term low is in place, the Direxion Semiconductor Bull 3X Shares (SOXL) has significant upside potential for a quick trade.
Aggressive traders could go long at $24.36 with a stop at $22.44 (risk of approx. 7.9%). Cancel the order if $26.60 is hit first or if the order is not filled by noon ET on Thursday (August 25). Sell half the position at $27.90 and raise the stop on the remaining position to $24.36.


