
With signs emerging that the bond bull market is drawing to a close, these three bond ETFs offer traders and investors varying degrees of leverage and favorable risk/reward opportunities.
Global interest rates surged in the first half of March and the weekly momentum analysis of the 30-year Treasury bond yields suggests that yields did bottom in December. This action makes it more likely that the bond bull market is drawing to a close. While the market action is contrary to the stated Fed policy, I have found it much more reliable to invest or trade based on the market action rather than any public policy.
Of course, we need to see yields move even higher before we can be confident that the bull market is really over. The recent pullback in the leveraged and non-leveraged inverse bond market ETFs has created a good risk/reward entry point on the long side.
These three liquid inverse bond ETFs offer varying levels of risk, as well as potential reward for the investor or trader.
Click to Enlarge
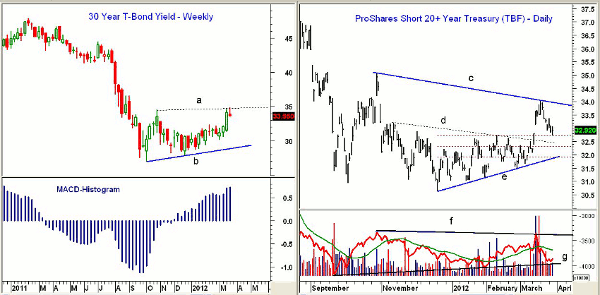
Chart Analysis: The weekly chart of the 30-year T-bond shows the October low in yields of 2.69%, which was well above the December 2008 low of 2.51%.
- The yield shows a slight uptrend (line b) which is now at 2.89%
- Next key resistance is at 3.45% and a weekly close above this level should signal a move to the 3.80%-4.00% level
- The MACD-Histogram moved above the zero line in early December and continues to make higher highs, consistent with rising yields
- A decline in yields back below 3% would be the first sign that yields have not bottomed
The ProShares Short 20+ Year Treasury ETF (TBF) is an unleveraged inverse bond ETF that had a high in early 2011 of $46.69. It is quite liquid and averages 900,000 shares in daily volume.
- The daily chart shows that after forming a series of higher lows (line e) last fall, it surged to a high of $34.03 on March 19
- There is additional resistance at $35 with the major 38.2% Fibonacci retracement resistance at $36.74
- Daily on-balance volume (OBV) formed a bullish divergence at the December low, line g. This support is now being tested
- A move through OBV resistance at line f would be very positive
- TBF is already back to the 38.2% Fibonacci retracement support at $32.73
- The former downtrend, line d, is now at $32.48 with the 50% retracement support at $32.32
- The daily uptrend, line e, and the 61.8% retracement support, are in the $31.80-$31.92 area
NEXT: 2 Leveraged ETFs for Trading the Bond Market Top
|pagebreak|
Click to Enlarge
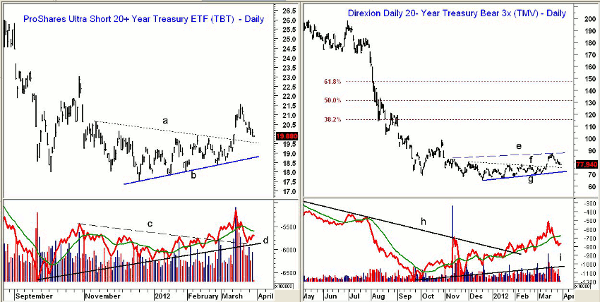
The ProShares UltraShort 20+ Year Treasury ETF (TBT) is a double-inverse bond ETF that averages over nine million shares in daily volume.
- TBT has already dropped below the 38.2% Fibonacci retracement support at $20
- The former resistance (now support, line a) is at $19.72 with the 50% retracement support level at $19.51
- The uptrend from the lows, line b, is now at $18.80
- Daily OBV is back below its weighted moving average (WMA) but has just retested its bullish divergence support, line d, and the former breakout level at line c
- OBV exceeded the October highs on the recent rally even though prices did not
- There is initial resistance at $21 and then at $21.55, which was the recent high
- The 38.2% retracement resistance from the 2011 high of $41.54 is now at $26.80
The longer-term chart for the Direxion Daily 20+ Year Treasury Bear 3x ETF (TMV) shows the dramatic decline in 2011. TMV is a triple-leveraged ETF that averages 374,000 shares in daily volume.
- The chart shows a potential bottom formation, lines e and g, with key resistance at $87.28-$87.80
- TMV is already down over 9% from the recent high, and the 38.2% support at $78.67 has been broken
- The former downtrend, line f, is now at $76.90
- The 50% Fibonacci retracement support is at $76.01 with the 61.8% support at $73.34
- OBV broke its long-term downtrend, line h, in early 2012
- OBV bottomed in September and has since formed a series of higher highs and higher lows. It is well above positive divergence support at line i
- First resistance for TMV is at $82-$82.50, and once above the recent high at $87.27, there is further resistance at $95-$98
- The 38.2% Fibonacci retracement resistance from July’s swing high of $198.01 is at $116
What It Means: From a technical standpoint, the sharp selloff in the bond market in early March and the large increase in yields is consistent with the early stages of a major trend change.
Until the March highs in yield or the lows in price are violated, we cannot rule out the potential formation of another trading range. Historically, bonds are very likely to complete a top in the next year or so.
As a result, while it may take several attempts to get on the long side of these inverse bond ETFs, the current action favors buying.
How to Profit: Investors may attempt to buy both the ProShares Short 20+ Year Treasury ETF (TBF) and the ProShares UltraShort 20+ Year Treasury ETF (TBT) in equal amounts.
For the ProShares Short 20+ Year Treasury ETF (TBF), go 50% long at $32.80 and 50% long at $32.44 with a stop at $31.36 (risk of approx. 3.9%). Cancel the order if $33.80 is hit first.
For the ProShares UltraShort 20+ Year Treasury ETF (TBT), go 50% long at $20.02 and 50% long at $19.68 with a stop at $18.48 (risk of approx. 6.9%). Cancel the order if $22.90 is hit first.
Alternately, aggressive traders should consider going 50% long the Direxion Daily 20+ Year Treasury Bear 3x ETF (TMV) at $77.88 and 50% long at $76.68 with a stop at $70.22 (risk of approx. 9.1%). Cancel the order if $85.90 is hit first.
Find all of Tom’s market comments by bookmarking his columnist page.


