The early-year rally in the homebuilders has run into technical resistance, increasing risk for new longs and necessitating more active risk management for current positions.
Even though some of the strongest homebuilding stocks like Toll Brothers (TOL) and Lennar Corp. (LEN) made new 12-month highs on Wednesday, there are some signs that the group has lost some upside momentum.
This has been a market-leading group since last October when volume surged into the sector, suggesting the homebuilders had bottomed.
Next week, we get the latest reports on existing home sales (May 22) and new home sales (May 23), so any signs of technical deterioration could be forecasting some disappointing numbers from the reports. As a result, our current strategy needs to be adjusted accordingly.
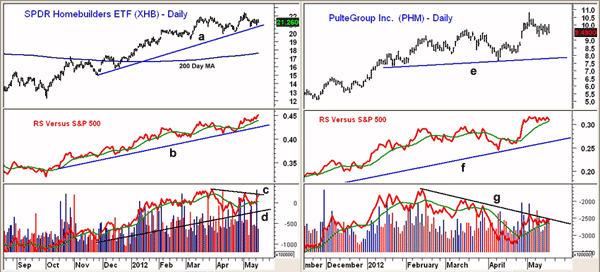
Chart Analysis: The SPDR S&P Homebuilders ETF (XHB) made new highs at $22.43 in early May, but closed Wednesday more than 5% below these highs. The daily uptrend, line a, is now at $20.68.
- There is further support now at $19.92 and the April lows. The rising 200-day moving average (MA) is currently at $17.57
- Relative performance, or RS analysis, made new highs on Wednesday, as XHB is still leading the market higher. There is more important support at line b
- Daily on-balance volume (OBV) did not confirm the recent highs, line c, but is now testing this resistance, which makes the short-term action important
- Daily OBV now has important support at the uptrend, line d
- Weekly OBV (not shown) has also not confirmed the new highs and is below its weighted moving average (WMA), making this week’s close especially important
- Minor resistance now stands at $21.70
PulteGroup (PHM) spiked to a high of $10.82 on May 2 but is already down more than 12% from those highs. There is next support in the $9.10-$9.20 area.
- There is major support in the $7.80 area, line e
- RS analysis made a new high with prices and is still holding above its WMA
- Daily OBV peaked in February and has formed lower highs over the past three months, line g
- Daily OBV is just barely above its weighted moving average and shows a pattern of lower lows
- Weekly OBV (not shown) has also formed a negative divergence
- There is initial resistance in the $10-$10.10 area
NEXT: One of the Weakest Homebuilder Stocks Out There
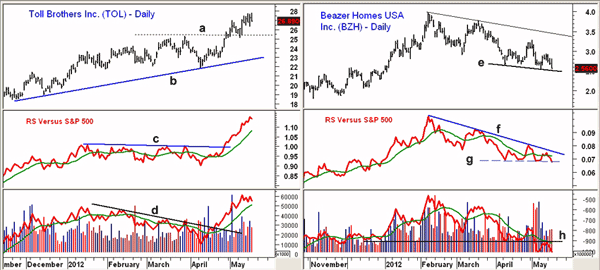
|pagebreak|Toll Brothers (TOL) closed above resistance, line a, on April 27 and surged over $2 in the next ten days. TOL had a recent high of $27.80, which is very close to the 2008 high of $28.
- RS analysis also broke out to the upside in April as it was able to overcome the resistance at line c
- The RS line still looks strong, as it is well above its rising weighted moving average, and the weekly RS line (not shown) has moved to significant new highs
- OBV has formed slightly lower highs over the past few days but is still holding above its weighted moving average
- The breakout in the OBV (line d) preceded the price breakout by over a week
- There is minor support at $26.32 and first good support in the $25-$25.10 area
Beazer Homes (BZH) has been one of the weakest stocks in this industry group, as it violated the 50% Fibonacci retracement support at $2.68 last week. The daily chart now shows a pattern of lower highs.
- BZH is now very close to breaking support in the $2.50 area, line e
- The RS analysis confirmed the February highs but has corrected further than I expected
- It is also very close to breaking key support at line g, which would be a negative sign
- Daily and weekly OBV both confirmed the highs early in the year, but the daily OBV formed lower lows last month
- Volume was high on last week’s decline and the daily OBV has broken support, line h
- Initial chart resistance now stands in the $2.80-$3.00 area
What It Means: The divergences between volume and prices in the leading homebuilders ETF as well as two of the top-performing stocks suggest the risk on the long side has increased. We took some nice profits on the homebuilders early in the year and then bought again in early April.
Though we have already taken some nice profits on two of our positions, now is the time to raise the stops even further. Our long positions in BZH are likely to be stopped out, but if we get a bounce, it would be advisable to lighten up on that position.
How to Profit: There are no new recommendations in the homebuilders at this time, but if we are stopped out of existing longs, I will be looking at these stocks again once the stock market bottoms out.
Portfolio Update
- Buyers should be 50% long SPDR S&P Homebuilders ETF (XHB) at $20.28. Raise the stop on this position to $20.52.
- For PulteGroup (PHM), buyers were 50% long at $8.16 and 50% long at $7.68. Half the position was sold at $10.34 or better. Raise the stop to $8.88 at this time, and on a move above $10.08, raise the stop further to $9.26.
- For Toll Brothers (TOL), buyers were 50% long at $22.48 and sold half the position at $27.34 or better. Raise the stop now to $24.89.
- Aggressive traders are 50% long Beazer Homes (BZH) at $2.92 and 50% long at $2.70 with a stop at $2.47. Sell half the position at $2.74 or better, and on a move above $2.88, raise the stop to $2.69.


