While these overbought Dow stocks are likely to correct lower, two of these Dow stocks look attractive at lower levels, and one market leader may be ready to disappoint on earnings.
The strong rally at the end of the month pushed the major averages into positive territory. The SPDR Dow Jones Industrials ETF (DIA) closed up 0.97%, which slightly lagged the 1.18% gain in the Spyder Trust (SPY).
The markets are waiting for a series of potentially market-shaking events, starting with the FOMC announcement Wednesday afternoon, the ECB announcement Thursday morning, and then of course the monthly jobs report Friday morning. Therefore, volatility is likely to be high for the rest of the week.
This makes my monthly scan of the stocks in the Dow Jones Industrials especially interesting. Each month, I review which Dow stocks are closest to either the monthly Starc+ or Starc- bands.
When a stock is trading at or above its Starc+ band it is in a “high risk” buy area or overbought, as the odds favor a pullback, or at least some consolidation. Those stocks that are close or below their Starc- bands are in a “high risk” sell area or oversold, as they are likely to move sideways or rally.
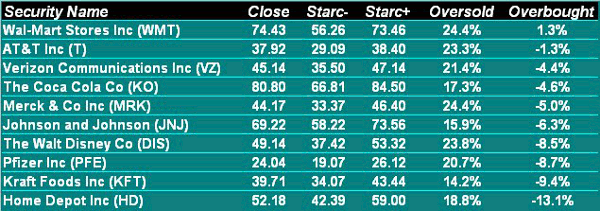
This month, I am focusing on the stocks that are closest to their monthly Starc+ band. The first stock on the list, Wal-Mart (WMT) closed the month 1.3% above its Starc+ band. This list also contains many of the stocks that I recommended over the past several months, but in most cases my buying zones were too low, and unfortunately our orders would not have been filled.
The monthly relative performance and on-balance volume analysis, combined with the monthly chart analysis, indicates that two of the stocks on the list will be good buys at a bit lower levels.
Next: Wal-Mart Chart Analysis
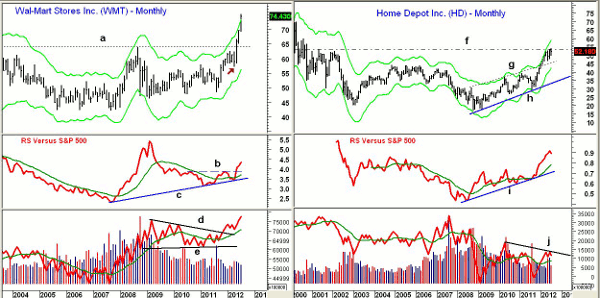
|pagebreak|Chart Analysis: In May, Wal-Mart (WMT) staged a major upside breakout when it closed above the resistance at $61, line a. The technical studies had favored an upside breakout early in the year but our longs were stopped out on the April drop in reaction to the bribery scandal.
- The breakout has further upside targets in the $78 to $80 area.
- The relative performance or RS analysis confirmed the price action by overcoming the resistance (line b), after forming a long-term uptrend (line c)
- The monthly on-balance volume (OBV) turned positive at the end of 2011 as it moved above resistance (line d). This completed the OBV trading range (lines d and e), which is very positive.
- The weekly analysis (not shown) is positive, but WMT has been trading above its weekly Starc+ band for the past few weeks. A lower weekly close should signal the start of a correction
- First good support sits in the $70.20 to $72 area.
On the bottom of the list is Home Depot (HD), which led the list early in the year. HD has reached strong resistance from 2000-2001 in the $53.75 area (line f). The monthly Starc+ band was tested from January through April 2012.
- The first monthly support (line g) is at $45.50, which is just below the prior five-month lows.
- The monthly Starc- band is now at $42.39.
- The relative performance has formed higher highs and is well above the support (line i).
- The monthly on-balance volume (OBV) has formed lower highs since 2010 (line j), and has turned lower in July but is still above its WMA.
- The weekly analysis (not shown) does look toppy, as the OBV and RS have both formed short term negative divergences.
- On a close above the recent high at $54.20, there is next major resistance in the $60 area.
Next: Merk
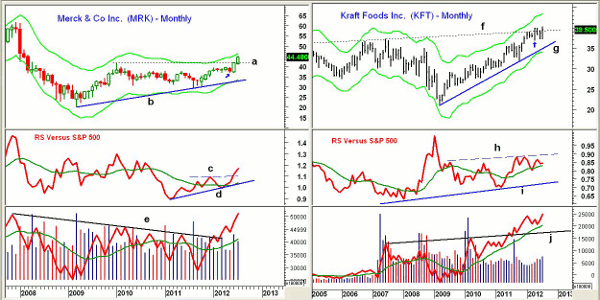
|pagebreak|Merck (MRK) closed on long-term resistance (line a) at $41.75 last month. This resistance was decisively overcome in July, as MRK closed on the month’s high.
- There is next long-term resistance at $47.50 and then in the $50 area.
- The monthly relative performance overcame resistance (line c) in June. The RS line had formed higher lows (line d).
- The long-term resistance in the OBV (line e) was overcome at the end of February.
- The weekly OBV (not shown) did not confirm the recent highs.
- There is first support now in the $42.80 to $43.60 area, and then in the $40.50 area.
Kraft Foods (KFT) reversed to the upside in April (see arrow) and closed above monthly resistance. Since then, it has had little follow-through to the upside. The stock had a wide range on July 25, dropping as low as $37.15 before closing strong at $38.84.
- The monthly Starc+ band is at $43.44, and KFT made a high in 2002 at $43.95.
- The relative performance is above its WMA, but still below resistance (line h).
- The monthly OBV shows powerful accumulation, as it moved through long-term resistance (line j) in June 2011.
- The OBV is acting much stronger than prices, and the weekly OBV (not shown) is also showing good strength.
- There is initial support in the`$38.80 area and then at $37.80.
Next: What it Means |pagebreak|
What it Means: Wal-Mart (WMT) has been leading the most overbought list for the past few months, suggesting that a pullback is becoming more likely. They report earnings on August 16.
The technical outlook on Home Depot (HD) has weakened ahead of its earnings on August 14. Therefore, I would not be surprised to see a pullback to the $49.50 to $50 area, and have no new recommendation.
For Merck (MRK), I recommended on July 3 to buy at $40.52, but it never got below $41.06. I still like it on a pullback.
I also like Kraft Foods (KFT), but it reports earnings on August 2, so I would only put an order into buy near last month’s lows, where a tight stop can be used.
How to Profit: For Merck (MRK), go 50% long at $41.84 and 50% long at $40.66, with a stop at $39.33 (risk of approx. 4.6%).
For Kraft Foods (KFT), go 50% long at $38.44 and 50% long at $37.82, with a stop at $36.48 (risk of approx. 4.3%).
Portfolio Update: Investors should be 66% long AT&T (T) from $28.57, with a stop now at $33.34. One-third of the position was sold at $34.11 or better.
For Pfizer (PFE), investors should be 50% long at $22.22 with a stop at $21.86.


