
It’s always wise to calculate the risk before entering a new trade, and technical analysis can help determine the price level at which to buy or sell, but as MoneyShow’s Tom Aspray illustrates below, the market doesn’t always cooperate.
The volume increased bit on Tuesday’s decline and the market internals were weaker than prices. The A/D lines and McClellan oscillator have turned lower. A drop in the Spyder Trust (SPY) below last Friday’s low of $154.66 should signal a correction to the next support in the $152.80-$153.20 area.
Though a deeper correction is possible, I would expect buyers to step in if the market drops further and think a correction will be a buying opportunity. Of particular interest will be the behavior of the best performing sectors when the market does correct.
In reviewing some of my recent recommendations, it appears that while I may have had the right idea, my entry prices were never hit. The updated analysis of these stocks may provide some additional insights.
Click
to Enlarge
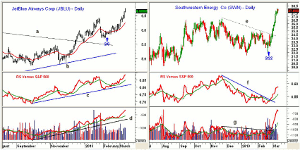
Chart Analysis: On February 8, I took a look at the Dow Jones Airlines Index (DJUSAR) and recommended buying JetBlue Airways (JBLU).
- Three days later, the low was $5.84, which just missed the initial buy level at $5.83.
- JBLU started a gradual uptrend as it frequently tested its rising 20-day EMA.
- The next week, the relative performance moved above its WMA and soon the WMA was clearly rising.
- The OBV held above its WMA and in early March broke out to new rally highs.
- JBLU is now trading close to its daily starc + band as it had a high this week of $6.76.
- The quarterly R2 resistance at $6.76 has now been exceeded.
- The next major resistance is at $7.24 and then the 2010 high of $7.60.
- The first good support is now in the $6.40 area.
Southwestern Energy (SWN) was recommended in a February 22 column as it had just dropped sharply on disappointing earnings.
- In the next two days, it had another wide ranging day but only traded as low as $32.86, which was above my initial buy level at $32.06.
- The downtrend in the relative performance (line f) was broken on February 26, and it soon moved above its previous resistance.
- The OBV broke through its major resistance, line g, by the end of the month after forming a bullish zig-zag formation (see circle).
- The OBV has been very strong in March.
- The 2012 highs have been overcome with resistance from 2011 at $44.36.
- The first support is now in the $35.50-$36 area.
NEXT STOP: The Importance of Stops
|pagebreak|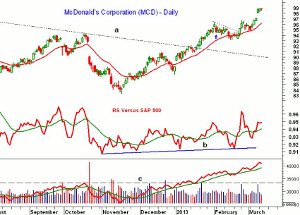
Click
to Enlarge
McDonald’s Corp. (MCD) was recommended as one of the most overbought Dow stocks in early February. It had also been recommended in December, but my stops were too tight as it was stopped out at the end of the month.
- In the middle of January, the long-term downtrend from the early 2012 highs was overcome.
- The 127.2% Fibonacci retracement target from the corrective pattern is at $107.41.
- This suggested that the year-long correction in MCD was over.
- In early February, I was looking for a pullback as MCD seemed overextended.
- The initial buy level was at $92.88 but on February 14, the correction low was just $93.19 and soon the correction was over as the downtrend (dashed line) was overcome.
- The relative performance shows a basing pattern (line b) as does the weekly RS line.
- The on-balance volume (OBV) broke through major resistance, line c, well ahead of prices and continues to act strong.
- MCD has traded above the starc+ bands for the past few days and has reached the monthly pivot resistance at $98.86.
What it Means: These three examples illustrate a key frustration for both investors and traders. It happens when your market analysis is correct, but your entry level is not hit. As I discussed in more detail in 5 Rules for Success in 2013, my entry levels are often determined by where I think the stop needs to be placed.
In these examples, hindsight makes it clear that a tighter stop could have been used. For now, I would cancel any open buy orders for these stocks.
How to Profit: No new recommendations, but there are a few additions to the recently published Charts in Play portfolio.
Portfolio Update: Should be 50% long Calpine (CPN) at $18.52 with a stop now at $17.94.
Should be 50% long Nucor Corp. (NUE) at $44.84 and 50% long at $43.96, with a stop now at $43.17.
Should be 50% long LyondellBasel Industries NV (LYB) at $56.32 with a stop now at $56.81. Cancel the order to add to the position.
Should be long 50% long Atwood Oceanics Inc. (ATW) at $49.27 and would still add another 50% long at $48.42, with a stop at $46.46.


