
As the sell-off in gold resumed from where it left off last week, with other markets following suit, MoneyShow’s Tom Aspray counsels investors to be on alert for signs of a pullback in stocks as well.
US stocks had another good week, but early Monday there has been some selling overseas as weaker than expected data on China’s growth pushed the Hang Seng and Nikkei 225 almost 1.5% lower. European markets are also lower with most of the major averages down around 0.60% in early trading.
The volatility last week, however, was concentrated in gold and crude oil with gold having its largest one-day decline in many years. As the gold futures and the Spyder Gold Trust (GLD) cracked important support, it triggered a series of stops that exacerbated the decline. The stock market bulls are hoping that those who sold their gold will buy stocks.
The decline in crude oil was also pretty dramatic as it dropped almost $3 per barrel on the heaviest volume since January. This should be a positive for consumers as the decline in gas prices is likely to continue. However, lower demand for crude oil is normally not a positive for the economy, and this is consistent with my Week Ahead view that stocks may have gotten ahead of the economy.
Bonds are the third market that may have turned last week as the yields on both the 10-year T-notes and 30-year bonds have turned lower. Yields have been rising since last summer, and if they have now turned lower, it may be a sign that the bond pros are skeptical that stocks can move much higher.
The technical outlook for the S&P 500 and Dow Industrials is still positive, but there are two key market sectors that I focused on in Buy, Sell or Hold that will need to be watched closely this week. Take a look at these charts to see the alerts that have me concerned..
Chart Analysis: The weekly chart of the Spyder Gold Trust (GLD) shows the decisive break of support, line b, in the $148 area.
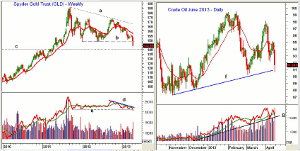
Click
to Enlarge
- The quarterly S2 support at $143.08 is not far below Friday’s close.
- The next important level of support is in the $140 area, which is the major 38.2% Fibonacci support from the 2008 lows.
- Four weeks ago, the on-balance volume (OBV) closed above its WMA and tested its downtrend, line d.
- Gold was just a bit lower the next week and the OBV also reversed.
- The selling last week was heavy as the OBV broke its support that goes back late 2011.
- In order for the OBV to turn positive, it now needs to move above its previous peak, which is unlikely to happen very soon.
- Last week’s bounce failed just below the monthly pivot at $154.10.
The daily chart of the crude oil contract for June 2013 shows that the daily uptrend, line f, was briefly broken on Friday.
- There is next support in the $90 area with more important at $87-$88.
- The quarterly S2 pivot level is at $86.39.
- The volume was heavy Friday as the uptrend in the OBV, line g, is now being tested.
- The weekly OBV (not shown) has been acting stronger than prices and is still above the 2011 and 2012 highs.
- There is first resistance at $92 with much stronger in the $95 area.
NEXT PAGE: Is the Bond Market Right?
|pagebreak|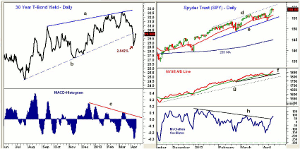
Click
to Enlarge
The yield on the 30-year T-bond had been rising since the July low of 2.46% and hit a high of 3.84% in early March.
- The uptrend, line b, was broken on April 4 as yields dropped to a low of 2.842% the following day.
- The daily chart of the MACD-His has been forming lower highs since December, line c.
- It has been below the zero line since the middle of March.
- Of course, to use the MACD-His correctly, one must look also at a long-term time frame.
- The weekly MACD-His (not shown) formed a negative divergence in early February and dropped below the zero line two weeks ago.
The daily chart of the Spyder Trust (SPY) continues to look positive with the new highs last week.
- There is monthly pivot resistance now at $161 with the weekly starc+ band at $162.35.
- The upper boundary of the trading channel, line d, is at $163.20.
- The 20-day EMA is at $156.37 with the trend line support, line e, at $154.58.
- The majority of stops are likely under $153.77 and the rising 200-day MA is $144.72.
- The NYSE Advance/Decline line made new highs last week with first support at its WMA and the uptrend, line f.
- There is longer-term support for the A/D line at line g.
- The McClellan oscillator, a short-term A/D indicator, has broken its pattern of lower highs, line h, which is a positive sign.
What it Means: The heavy liquidation in both gold and crude oil may be the result of a hedge fund blowing up, and if so the news will leak out soon. Still, anytime I see extreme moves in two of the key markets, I tend to watch all of the markets more closely. As I have noted before, crude oil often leads the stock market.
The turn in yields for both the 30-year bond and the 10-year T-note is more likely a reflection of a change in sentiment and some may remember that bond traders moved out of stock and into bonds in the spring of 2012.
How to Profit: No new recommendation


