
Sector rotation strategies build upon the logic that some sectors are stronger than others at key points in the market and economic cycle, and MoneyShow’s Tom Aspray identifies one sector that is ripe for a correction.
As the stock market continued to grind higher, some lagging industry groups have started to join the party as many have started to catch up with the overall market. Many of the coal stocks had sharp gains Tuesday as the Nonmetallic Mineral Mining group gained over 3%.
In early trading, the stock index futures are trading higher and the NYSE Advance/Decline has continued to make new highs confirming the higher prices. Many stocks, as noted Monday, are trading above both the weekly and monthly starc+ bands making them high-risk buys at current levels.
Also, some of the stocks in the hottest sectors are starting to show signs that they are topping out as investors are trying to lock in some profits and buyers are looking elsewhere. One top group, the DJ US Asset Manager Index is up 29.7% for the year versus a 14.4% gain in Spyder Trust (SPY).
A technical look at some of the key asset manager stocks reveals why now may be a good time to take some profits as a 5-8% correction would just take them back to support.
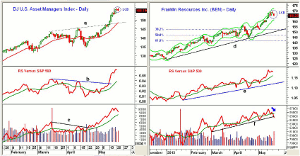
Click
to Enlarge
Chart Analysis: The daily chart of the DJ US Asset Manager Index triggered an LCD Tuesday as it closed at 155.19, which was below Monday’s doji low of 155.34.
- There is next support at 152.92 with more important in the 146.50 area.
- This corresponds to the breakout level (line a) and the rising 20-day EMA.
- A close below last week’s low at 147.92 would be much more negative.
- The relative performance confirmed the recent highs, and it is still well above its rising WMA.
- The daily OBV broke through resistance, line c, on April 22, which was two days after the low at 134.65.
- There were no divergences at the recent highs but it has turned lower.
Franklin Resources Inc. (BEN) is a $35.19 billion asset manager that provides a wide range of services. BEN made a low of $144.10 in the middle of April and a new 52-week high at $169.62 on Monday when a doji was formed.
- The close Tuesday was well below Monday’s low so an LCD was triggered.
- The 38.2% Fibonacci retracement support from the late 2012 lows is at $152.
- The uptrend, line d, is at $150.23 with the 50% support at $146.58.
- The relative performance is still positive but it did not make a new high on Monday.
- The on-balance volume (OBV) formed a negative divergence on Monday (see arrow) and broke its uptrend, line f, on Tuesday.
- Monday’s high was $169.62 with the R3 pivot resistance at $173.54.
NEXT PAGE: 2 Stocks Ready for Pullback
|pagebreak|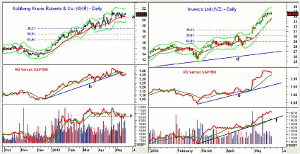
Click
to Enlarge
Kohlberg Kravis Roberts & Co. (KKR), a $5.52 billion investment firm, has not made a new rally high since April 25 as it has moved sideways.
- There is now key short-term support at $20.25, line a. A close below this level should complete a short-term top.
- The 38.2% retracement support from the December low at $13.35 is at $18.50.
- The more important 50% support level is at $17.50.
- The uptrend in the relative performance, line b, was broken last week as it appears to have topped out.
- The OBV made marginal new highs in April but then broke support on May 9.
- The OBV just barely moved above its declining WMA before turning lower Tuesday.
- The quarterly R1 resistance at $21.14 seems to have limited the upside and represents initial resistance.
Invesco Ltd. (IVZ) is a $15.3 billion asset management company that was originally recommended in March’s column 4 Strong Stocks in Top Sectors.
- IVZ made a high of $34.95 on Monday and closed below Monday’s low Tuesday.
- Last Friday, another doji was formed with a low of $34.31 and a close below this level would complete a LCD.
- There is further support in the $33 area with the minor 38.2% Fibonacci support (from the March lows) at $31.35.
- There is more important support in the $30-$30.36 area.
- The relative performance is declining and has been diverging from prices for the past week.
- The daily OBV did confirm the highs and continues to look strong.
- The OBV has good support at line f and the rising WMA.
- For the past three weeks, IVZ has traded above its weekly starc+ band, so risk is high.
What it Means: The number of negative formations in the asset manager stocks suggests they are ready for a pullback. There are no signs yet of a top for the financial sector so this may just be sector rotation and not an early sign of a market correction.
How to Profit: No new recommendation
Portfolio Update: Should be long Invesco Ltd. (IVZ) from $27.73 and sold half at $33.22. Would sell the remaining position on the opening (advice was tweeted before the opening).


