
It is easy to lose sight of the forest for the trees, so MoneyShow's Tom Aspray recommends reviewing your holdings regularly to make sure you have a game plan in place ahead of time in case stocks undergo a steeper decline.
As expected, August is already looking more difficult than July. After the first seven days of trading in July the Dow Industrials was up 2.5%, while after Friday's drop it is down 0.40%, so far in August.
Stocks got a boost in July from the better-than-expected earnings but there are more cross currents ahead in August that may dampen some of the recent euphoria of stock investors. This may make it a more treacherous end to the summer so I continue to suggest that you don't leave on vacation without a plan for your portfolio.
Review each of your holdings and look at how they may react if the market has a 5% or 10% decline. One approach is to see how far it is above, say a 50-day MA. If your original plan was for the investment to be a core position, then use a stop under major support. If you have not yet taken any profits in those positions that are doing well, consider it now.
Stocks in Asia were generally higher Monday except for Japan where its growth data missed expectations. The European markets are down across the board with the Dow futures down 50 points. The full economic calendar this week and the potential for another round of taper fears could hit a market that has already lost some of its upside momentum.
The review of the July recommendations for the Charts in Play Portfolio shows that while some did pop, others did not, and it is time for a review of the current holdings.
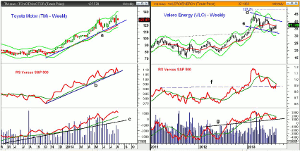
Click
to Enlarge
Chart Analysis: Toyota Motors (TM) has a very wide range two weeks ago as its second quarter profits doubled, and the stock hit a high of $134.93.
- This is still the key level of resistance with the
quarterly R1 pivot resistance at $136.11.
- The weekly starc + band is at $140.54.
- The relative performance moved above its WMA last
October and has been in a strong uptrend, line b.
- The weekly OBV has also been strong as it made
another new high two weeks ago.
- The OBV is well above its rising WMA and the uptrend,
line c.
- There is initial support now in the $124-$125 area with the quarterly pivot support at $120.80, and the July low
at $120.11.
Valero Energy (VLO) was a favorite in 2012 and was the only one of three energy picks in July where my recommended buying level was hit.
- The weekly chart shows a classic flag formation, lines d and e.
- The July lows tested the 38.2%-50% Fibonacci support
levels, which is where a correction is likely to end.
- The close was above the 20-day EMA with next
resistance in the $40-$41 area and the weekly starc+ band.
- The relative performance did confirm the price highs and
has turned up from support at line f.
- The OBV has also tested its support at line g and is
below its WMA.
- The upside target from the flag formation is the 127.2% Fibonacci retracement target in the $47 area.
- There is initial support now at $34-$35 and then in
the $33 area.
NEXT PAGE: What It Means
|pagebreak|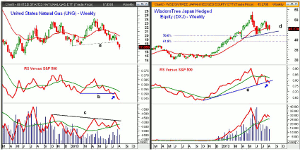
Click
to Enlarge
The fastest bad trade recommendation in July was in United Natural Gas (UNG) as it gapped to the downside the week after it was recommended, breaking the support at line a.
- This also undercut the January lows at $17.38.
- The weekly starc- band is at $16.11 with the June
2012 low at $15.18.
- The relative performance also violated its support at
line b and is now well below its declining WMA.
- The weekly on-balance volume (OBV) was acting much better in
July as it looked ready to break through the resistance at line c.
- Instead, the rally failed as the OBV has dropped
below its WMA and the prior low.
- There is resistance at $18.49 with stronger above
$19.
On July 10, it looked as though the correction in the Japanese market was over as it had rallied sharply from the support levels I identified in June. The WisdomTree Japan Total Dividend Index (DXJ) made its high six days later at $49.54.
- DXJ hit a low late in the month at $44.65 and is just
holding above weekly support at line d.
- There is further support in the $42.58-$43 area with
the 50% retracement support at $42.
- The relative performance did move above its WMA in
July before turning lower.
- The uptrend in the RS, line e, was broken last week.
- The weekly OBV is positive but has now turned lower.
- The monthly pivot is at $46.44 with further
resistance at 47.37.
What It Means: Until there are clear-cut sell signals for the overall market, it is not clear whether we will see a 5% correction or more like 10-12%.
Natural gas a seasonal tendency to bottom in July and the weekly OBV was strong while the relative performance was not. It would have been better to wait for confirmation of a bottom.
For those positions that have done well, I would not recommend a full one, while the Japanese market looks as though it could drop below the June lows before the correction is over. Some sectors, like the oil stocks, have not rallied with the market and could emerge as market leaders this fall.
How to Profit: No new recommendation.
Portfolio Update: For Toyota Motor Corp. (TM), should be 50% long at $120.96, with a stop at $114.83.
For Valero Energy Corp. (VLO), now 50% long at $34.90 and 50% at $34.11, use a stop at $32.84
For United States Natural Gas (UNG), went 50% long at $19.67 and 50% long at $19.56, both stopped out $18.27.
For the WisdomTree Japan Total Dividend Index (DXJ), should be 50% long at $44.54 and 50% long at $43.26. Use a stop now at $44.38.
For the WisdomTree Japan SmallCap Dividend (DFJ), should be 50% long at $45.66 and 50% long at $44.76. Raise the stop to $46.36.
NEXT PAGE: The Charts in Play Portfolio
|pagebreak|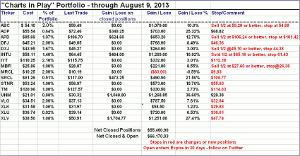
Click
to Enlarge


