Although this tech giant has lost most of its mystique since the death of Steve Jobs, MoneyShow’s Tom Aspray takes a technical look to see whether it can still deliver outstanding performance and provide the impetus to propel its sector higher in the months ahead.
Another day of selling in the US markets that was blamed on fears that the Fed would taper earlier than expected? Sound familiar? Unfortunately the financial media seems as though it needs to have a specific reason to explain either market rallies or declines.
The decline from last Friday’s highs was consistent with the technical deterioration since the November 18 highs. The decline on Monday took many of the technical indicators below support, which made a further decline likely.
The Eurozone markets are higher in early trading after the EU left rates unchanged. The US futures are showing solid gains heading into the widely watched monthly jobs report that is due out before the opening. A higher daily close will set the stage for a further rebound.
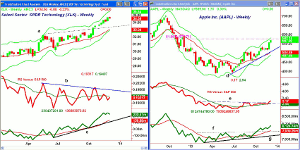
The Sector Select Technology (XLK) is the only major sector to make new highs this week as it broke through seven-month resistance in October. Of course, Apple Inc. (AAPL) at 15% is the largest holding in XLK as it is almost double the holding in Google, Inc. (GOOG).
Apple, Inc. (AAPL) is up 18.2% since the October lows compared to 11.8% in the PowerShares QQQ Trust (QQQ) and 10% in XLK. This is more than double the 8.7% gain in the Spyder Trust (SPY).
Of course, the question is can AAPL continue to power the tech sector higher?
Chart Analysis: The weekly chart of the Sector Select Technology (XLK) overcame key resistance, line a, in October.
- The weekly chart shows that XLK is still well below the monthly starc+ band at $35.54.
- This is very close to the monthly projected high at $35.61 with the quarterly R3 resistance at $35.20.
- The weekly relative performance has not confirmed the price action as it is still below its flat WMA.
- The daily RS analysis (not shown) dos look more positive as it is well above its WMA.
- The OBV dropped below its WMA last June but held well above the previous lows.
- Since then the OBV has held above its WMA but has tested it twice.
- Each test of the OBV was a good buying opportunity as it has made sharply higher highs in the past two months as its WMA was rising strongly.
- There is first good support at $34.25 with the monthly projected pivot support at $33.86 and stronger support at $33.
The weekly chart of Apple, Inc. (AAPL) shows a solid uptrend, line d, that connects the June and September lows.
- The rally is now testing the 61.8% Fibonacci retracement resistance from the high at $705.07.
- The quarterly R2 resistance at $574.66 was overcome this week.
- The daily starc+ band is being tested with the monthly projected pivot high at $588.21.
- The weekly relative performance has completed its bottom formation by moving above resistance at line e, last week.
- The weekly OBV has also completed its bottom formation, lines f and g, and made a new rally high this week.
- The daily OBV (not shown) is also strong, therefore, the OBV multiple time frame analysis is pointing higher.
- The daily chart has first support at $548-$554 with the monthly pivot at $542.26.
- The sharply rising 20-day EMA is at $538.28.
NEXT PAGE: The Sub-Sector to Watch
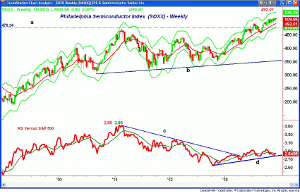
|pagebreak|The Philadelphia Semiconductor Index (SOXX) contains 30 of the top US semiconductor stocks with 8% holdings in Texas Instruments, Inc. (TXN), Qualcomm, Inc. (QCOM), and Intel Corp. (INTC).
- The weekly chart shows that the early 2011 high, line a, in the 478 area was overcome last July.
- The SOXX then pulled back to its 20-week EMA in August before resuming its uptrend.
- SOXX is now testing its quarterly R1 resistance and is well below its weekly starc+ band at $535.29.
- There is weekly support now in the 487 to 500 area and the rising 20-week EMA.
- The quarterly pivot is at $482.19.
- The relative performance broke its two-year downtrend, line a, in early 2013.
- The RS line pulled back in April and then formed a solid uptrend, line d.
- The RS line has turned up but is still below its WMA.
- The daily RS analysis (not shown) does look stronger and shows a formation similar to that at the end of August.
What It Means: The daily and weekly technical action of Apple, Inc. (AAPL) is positive and suggests that it is likely to move higher in 2014. New all-time highs are a real possibility. Over the near term, it is overbought and likely to correct in the next month or so, which should present a buying opportunity.
Apple’s strength should be a positive psychological factor for the entire tech sector as its correction from the September 2012 highs hurt the entire sector.
The action in the semiconductor group also looks encouraging. I will be watching the Market Vectors Semiconductor ETF (SMH) even though it is less diversified than SOXX as 71% of the ETF are in the top ten holdings with almost 20% in Intel Corp. (INTC) and 14% in Taiwan Semiconductor Manufacturing Ltd. (TSM).
How to Profit: For Apple, Inc. (AAPL), go 50% long at $544.45 and 50% long at $532.65, with a stop at $506.39 (risk of approx. 6.0%).


