The biotech sector has been one of the market’s top performers, but it has recently pulled back, and MoneyShow’s Tom Aspray wonders whether the tech sector can take up the slack and propel the QQQ higher if biotech fails to regain its mojo.
The weaker-than-expected reports from ADP on employment, along with the disappointing ISM Non-Manufacturing Index, made for a mixed close as the Dow Industrials was lower, the S&P 500 was flat, and the Nasdaq 100 managed a slight gain.
The market internals were neutral while advancing volume was a bit higher. It certainly has been a split market, so far in 2014, as the SPDR Dow Industrials (DIA) is down 0.95%, the Spyder Trust (SPY) is up 1.66%, and the PowerShares QQQ Trust (QQQ) is up 3.95%.
The markets are waiting for the announcement by the ECB before Thursday’s opening, as well as the monthly jobs report on Friday, to see if either will clarify the economic outlook. The manufacturing data early in the week was better than expected and many are hoping that a spring thaw will stimulate the consumer to buy.
So far in 2014, the biotech sector has gotten the most attention as the iShares Nasdaq Biotechnology (IBB) is up an astounding 18.16% YTD but many are wondering if this industry group consolidates what can push the QQQ even higher?
The top four holdings in the PowerShares QQQ Trust (QQQ) make up almost 30% and include the tech giants Apple, Inc. (AAPL), Google, Inc. (GOOG), Microsoft Corp. (MSFT), and Amazon.com Inc. (AMZN).
Of these stocks, only GOOG has outperformed the QQQ in 2014 as it is up 8.70%. The worst performer, so far this year, is AMZN as it is down 6.63%, with AAPL losing 4.56%. MSFT is slightly lagging the QQQ as it is up only 2.62%.
An examination of the weekly and daily technical outlook for these four tech giants can give us some insight on whether they can help propel the QQQ even higher.
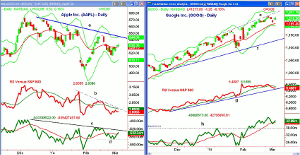
Chart Analysis: Apple, Inc. (AAPL) makes up 11.4% of the QQQ. The daily chart shows the sharp drop to the quarterly projected pivot support at $496.33 in late January in reaction to its earnings and guidance. The rebound has been equally quick.
- The pre-earnings resistance in the $550 level stalled the rally as AAPL has dropped back to the short-term 61.8% support in the $515 area.
- AAPL is now trying to close back above its quarterly pivot at $534.02 with the downtrend and starc+ band at $544.
- The daily relative performance has formed lower highs, line b, and is below its WMA.
- The weekly RS line (not shown) is below its slightly declining WMA.
- The daily on-balance-volume has moved back above its WMA this week.
- It needs to overcome its downtrend, line c, and the February highs to generate a stronger buy signal.
- The weekly OBV (not shown) is holding above its WMA.
Google, Inc. (GOOG) accounts for just over 8% of the QQQ. The daily trend line resistance, line e, was tested with the February 26th high of $1228.88.
- The rising 20-day EMA and monthly pivot at $1190.85 were tested on Monday’s drop.
- The daily uptrend is well below market levels at $1140 with the 2014 low at $1082.27.
- The daily relative performance has dropped below its WMA and is testing support at line g.
- The weekly RS analysis is positive and did confirm the recent highs.
- The daily OBV dropped down to test its recent lows in late January before rallying sharply.
- The daily OBV has just moved back above its WMA and did make a new high with prices.
- The weekly OBV (not shown) has also made a new high with prices.
- The daily starc+ band is now at $1244 with the monthly projected pivot resistance at $1291.71.
NEXT PAGE: 2 More Tech Stocks to Watch
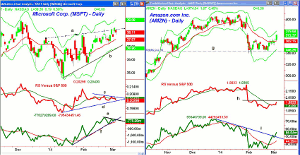
|pagebreak|Microsoft Corp. (MSFT) makes up 7.7% of the QQQ and has just tested the resistance from the prior two highs, line a.
- The daily starc+ band is at $39.08 with the monthly projected pivot resistance at $40.44.
- The 20-day EMA has been providing good support and it is currently at $37.57, which is just above the monthly pivot at $37.40.
- The daily uptrend, line b, is in the $36.90 area with the February low at $35.42.
- The daily relative performance has formed lower highs recently, line c.
- A drop in the RS line below support at line d would be more negative.
- The weekly RS line (not shown) is below its WMA.
- The daily OBV has formed a short-term negative divergence, line e, and is close to breaking its steep uptrend, line f.
- The weekly OBV is positive so there is a mixed reading from the OBV multiple time frame analysis.
Amazon.com Inc. (AMZN) makes up 4% of the QQQ and the stock now appears to have completed a double bottom on the daily charts.
- The 50% Fibonacci support from the August 2013 was violated in late January but not on a closing basis.
- AMZN was up 2.3%, Wednesday, and is back above its quarterly pivot at $366.47.
- The gap resistance from January is in the $375-$380 area.
- There is stronger resistance in the $400 area along with the weekly starc+ band.
- The daily RS line has moved back above its WMA and has key resistance at line h.
- A move above this level will indicate AMZN is a market leader, though the weekly RS line (not shown) is still below its WMA.
- The daily OBV has rallied sharply since it moved above its WMA on February 25.
- The OBV has broken its downtrend but the weekly is still below its WMA.
- There is minor support now in the $354-$360 area with the monthly pivot at $355.23.
What It Means: Let’s review each of these four stocks. Apple, Inc. (AAPL) looks positive from a weekly standpoint, but the daily analysis allows for a drop back towards the $500 level.
Google, Inc. (GOOG) is the strongest of the four stocks but does not appear to offer a good entry level unless it develops a new trading range.
Microsoft Corp. (MSFT) looks toppy on a short-term basis and would look more attractive in the $35-$36 area.
Amazon.com Inc. (AMZN) looks the most constructive on a pullback towards the monthly pivot using a stop under the late February lows.
I do not see enough strength in these four stocks to push the QQQ higher should the biotech sector lose some of its upside momentum.
How to Profit: For Amazon.com Inc. (AMZN), go 50% long at $359.10 and 50% long at $356.20, with a stop at $342.31 (risk of approx. 4.3%).


