With the markets remaining choppy in the intermediate term, MoneyShow’s Tom Aspray focuses his attention on a couple of high-yielding drug stocks that appear to have completed their corrections.
The new closing high in the Dow Industrials on Friday was consistent with my view from last month’s 4 Dow Stocks Under Accumulation that money was flowing into the large-cap, high-yielding stocks.
Of course, the question is how long can this outperformance last? Many are still trying to accept the fact that the utilities have been the best-performing sector in 2014. As I discussed in my review of Barron’s big money poll, this sector was the least-favored last fall by this group and this did not change in the most recent poll.
In the 52 years ending in 2012, dividends made up more that 60% of the real stock market returns. The recently recommended Vanguard Total World Stock Index (VT) has a current yield of 2.32%, which compares well with 2.62%—the historically low yield of 10-year T-notes.
The healthcare sector has been a favorite since 2012 when it broke out of a ten-year trading range. The Select Sector SPDR Health Care (XLV) has been a long-term portfolio holding since the fall of 2012. These two drug stocks have attractive yields and appear to have completed their correction, so they should be considered for your portfolio.
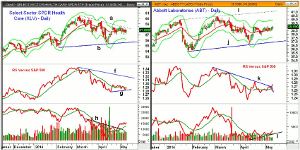
Chart Analysis: Select Sector SPDR Health Care (XLV) made its high of $60.28 on March 6 and dropped to a low of $55.39 on April 14. This was a decline of 8.1% from the highs.
- It is 90% invested in giant and large-cap stocks according to Morningstar with 12.8% in Johnson & Johnson (JNJ) and 8.3% in Pfizer Inc. (PFE). It has a current yield of 1.5%.
- For the past two weeks, XLV has been in a tight trading range as it has been moving above and below its quarterly pivot at $57.74.
- The daily starc- band is at $56.13, there is chart support at $55.60 with the quarterly projected pivot support at $55.21.
- The relative performance shows a potential bottom formation, line g.
- The RS line has key resistance at line f.
- The on-balance volume (OBV) is acting much stronger as it moved through resistance at line h, in late April.
- The OBV has continued to improve and is well above its WMA.
- More importantly, the weekly OBV closed at a new all-time high last week.
- Initial resistance is now at $58.57 and then at $59.49
Abbott Laboratories (ABT) reported rather weak earnings in the middle of last month but made its recent low on April 11 at $36.65. It has a current yield of 2.3%.
- The slightly rising 20-day EMA is at $38.54 with the monthly pivot at $38.24.
- ABT had a weekly close above its quarterly pivot of $37.99 on April 17.
- The monthly projected pivot resistance is at $39.79, which is very close to the daily starc+ band.
- The weekly starc+ band is at $41.11.
- The daily relative performance moved above its WMA two weeks ago and has just broken its downtrend.
- The daily OBV dropped below its WMA in early March but now appears to have bottomed.
- The OBV shows a shallow uptrend, line l, and is above its WMA.
- The weekly OBV (not shown) is now testing its WMA.
NEXT PAGE: 1 Drug Stock to Consider
|pagebreak|Bristol Myers Squibb Co. (BMY) barely beat earnings when it reported at the end of April but missed on revenues. The stock made its low at $48.26 in reaction to its earnings and it has a current yield of 2.80%.
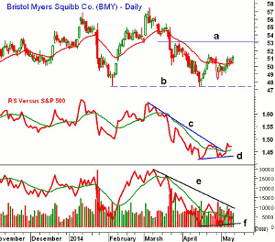
- BMY has closed above its rising 20-day EMA for the past four days.
- The quarterly pivot is at $51.96 with the monthly projected pivot resistance at $52.27.
- The 61.8% Fibonacci retracement resistance is at $53.43.
- The daily relative performance moved through its WMA and the downtrend (line c) last week.
- This completed a bottom formation, line d, suggesting BMY is becoming a market leader.
- The OBV has formed higher low, line f, and needs to overcome its downtrend, line e, to complete its bottom formation.
- The weekly OBV and RS lines (not shown) have turned up but are still below their WMAs.
- There is initial support now in the $49.85-$50.44 and the 20-day EMA.
What It Means: Though both Abbott Laboratories (ABT) and Bristol Myers Squibb Co. (BMY) need another strong week to confirm a new uptrend, they look similar to Baxter International Inc. (BAX) that was recommended in early March. It is now up over 9%.
How to Profit: For Abbott Laboratories (ABT), go 50% long at $38.73 and 50% long at $38.35, with a stop at $37.17 (risk of approx. 3.5%).
For Bristol Myers Squibb Co. (BMY), go 50% long at $50.88 and 50% long at $50.04, with a stop at $48.07 (risk of approx. 4.7%).


