The most oversold stocks will often drop more sharply when the market is weak, so MoneyShow’s Tom Aspray examines four of the six most oversold to see where they could eventually bottom out and which look the most interesting going into 2015.
The continued slide in crude oil prices finally spooked investors in all sectors on Monday and the selling has continued in early Tuesday trading. The Shanghai Composite dropped 5.6% as bond traders raised cash in reaction to new limits on what bonds could be used for collateral. This was not surprising after its recent run but the long-term chart suggests a major bottom has been completed.
Euro markets are also continuing lower as Monday’s data on German industrial output was weaker than expected. The S&P futures are down sharply ahead of the opening as they are trading below the December 1 low of 2048.25. A decisive close under this level could trigger another 15-25 point slide in the futures over the short-term.
The outlook for crude oil and the energy stocks has been negative since last summer as I reviewed in October’s How Low Will Oil Stocks and Crude Oil Go? Several weeks later, I warned that the energy sector could help precipitate a correction in the stock market.
In an updated look at the most oversold Dow stocks, I noted that many of Monday’s biggest losers were those stocks that were closest to their starc- bands. This analysis allows one to determine which stocks are closest to their upper starc bands (overbought) as well as those that are nearest to the lower starc bands (oversold).
As I always point out, overbought stocks can still go higher and oversold stocks can still go lower. The most oversold stocks generally are weaker than the S&P 500 (negative relative performance), which means they will often drop more sharply when the market is weak.
The analysis of four of the six most oversold stocks allows one to identify where they could eventually bottom out. There are two stocks which look the most interesting as we head into 2015.
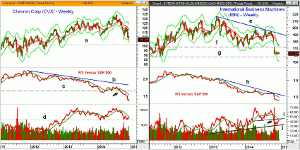
Chart Analysis: Chevron Corp (CVX) was already at the top of the most oversold list from the end of November before it dropped 3.67% on Monday.
- It is now just 1.6% above the monthly band with the weekly at $103.49.
- The next long-term support, line a, is at $101 with the monthly projected pivot support at $101.59.
- The weekly relative performance has been forming lower highs, line b, since 2012.
- The RS line broke long-term support, line c, early in 2014.
- It started to plunge again in September (see arrow), warning of the recent decline.
- The weekly OBV is still holding the support from 2012 and early 2014, which is an encouraging sign.
- The volume was heavy Monday and the daily OBV is negative.
- The monthly pivot and first strong resistance is at $112.07.
International Business Machines (IBM) has had a tough couple of years as it is down 11.44% YTD. Over the past three months it has lost 14.29%.
- The drop below the weekly support, line f, at $170.67 triggered another heavy wave of selling.
- The lows of the eight weeks in the $160 area are still holding.
- The monthly projected pivot support is at $157.14 with next major chart support, line g, in the $156.85 area.
- The relative performance started diverging from prices in 2012 and by early 2013 was in a clear downtrend, line h.
- The stock plunged on its October earnings, which dropped the on-balance volume (OBV) below support at line i.
- The weekly OBV is now approaching its long-term uptrend, line j.
- The sideways pattern on the daily chart (not shown) is characteristic of a continuation pattern, which favors another push to the downside.
- The weekly starc- band is at $151.92.
Next: Two More Oversold Stocks to Watch
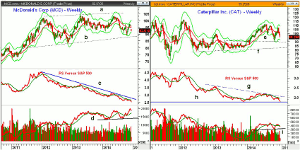
|pagebreak|McDonald’s Corp (MCD) dropped 3.84% Monday on over 11 million shares. The stock is down just over 1% in 2014. Its earnings and global sales have continued to keep the stock under pressure.
- The October low was $92.30 with longer-term chart support, line b, in the $88 area.
- MCD is still 7.3% above the monthly starc- band at $86.29.
- The RS line has been in a solid downtrend since it topped in early 2012.
- The resistance, line c, in the relative performance has clearly identified MCD as a market underperformer.
- The weekly OBV moved above its WMA on September 12 and then moved above the May highs.
- It is still holding above its rising WMA with major support at line d.
- The daily OBV is now on the verge of dropping back below its WMA.
- There is initial resistance now in the $97-98 area with the monthly projected pivot resistance at $100.67.
Caterpillar Inc. (CAT) has been held back by the drop in agricultural commodities as it is up just 7.75% YTD.
- CAT peaked at $110.44 in July, and with Monday’s 3.57% drop, is now down 13.75% from its highs.
- Over the past nine weeks, CAT has tested both the starc+ and starc- bands.
- The weekly band is now at $92.10 with the October low at $90.10.
- The monthly starc- band is at $87.18 with longer-term weekly chart, line f, at $82.13.
- The weekly relative performance completed a short-term top at the end of August.
- The long-term support for the RS (line h) is now being tested.
- The volume over the past three weeks has not yet been that heavy and the OBV is holding above the key support at line i.
- The daily OBV (not shown) has just turned negative.
- There is strong resistance now in the $98-$101 area.
What it Means: There are no signs yet that crude oil prices have bottomed but a very sharp short covering rally is likely before the end of the year as everyone is now jumping on the bearish bandwagon. I would not be surprised to see a $3-$5 upday as the shorts get squeezed. This could put a floor under some of the energy stocks that are quickly getting close to next major support.
International Business Machines (IBM) and Caterpillar Inc. (CAT) appear to have the best chance of forming a bottom in early 2015. Therefore, I will be looking for new daily buy signals.
How to Profit: No new recommendation.


