Though the stock market showed nice gains this week, the question remains if it was enough strength to break the major averages out of their trading ranges, so MoneyShow’s Tom Aspray studies the charts to see where we stand now.
This week’s impressive stock market gains have helped calm those remaining market bulls as in Tuesday trading both crude oil and stock traders were covering their short positions. Crude oil’s positive money flow resulted in a massive rally that took the futures quickly back to their monthly projected pivot resistance. The 56,000 drop in open interest supports interpretation that it was mainly a short squeeze.
All the major averages showed nice gains with the small-cap Russell 2000 up 1.83% and the Dow gained 1.76%. Both did better than the S&P 500 and Nasdaq 100, which were up 1.44% and 0.97%, respectively. The market internals were strong with advancing stocks leading the decliners by almost a 4-1 margin.
In last week’s analysis of the monthly charts and technical studies, the focus was on the long-term market trend. The conclusion was that there were no signs of a change in the major trend despite the mixed signals from the other time frames.
The key question for both investors and traders is whether the market now shows enough strength to break the major averages out of their two-month trading ranges. Though it is likely to be the weekly close that will tell us more, a look at the current technical readings will tell us where we stand now.
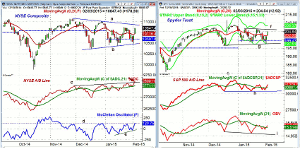
Chart Analysis: The NYSE Composite was up 1.67% Tuesday and closed on the highs. It needs to gain another 100 points or so to break through the resistance at line a.
- The NYSE Composite closed last Friday at 10,532, which was just below the quarterly pivot.
- The lower boundary of the trading range, line b, did hold.
- The daily starc+ band is at 10,992 with further resistance in the 11,100 area.
- The quarterly projected pivot resistance is at 11,309 with the weekly starc+ band at 11,280.
- The upside target from the trading range is in the 11,500-11,600 area.
- The daily NYSE Advance/Decline Line broke out to convincing new highs Tuesday and is acting stronger than prices.
- As bond yields rose Tuesday, the strength in the A/D line is less likely to be attributed to interest rate sensitive stocks in the NYSE.
- The McClellan oscillator closed last Friday at -37 but finished Tuesday at +120.75 as resistance at line d, is being tested.
- The 20-day EMA and initial support is at 10,716.
The Spyder Trust (SPY) had a low Monday of $197.86 after closing last Friday at $199.45, just barely above the quarterly pivot at $199.42.
- The key short-term resistance, line f, is still in the $206.26-$206.46 area.
- The daily starc+ band is at $208.37 and an upside breakout has targets in the $213-$216 area.
- The S&P 500 A/D line has moved back above its WMA that is trying to turn up.
- A strong move above the January highs in the A/D line will support the bullish case.
- A drop in the A/D line below the support at line h would be negative.
- The daily on-balance volume (OBV) has moved slightly above its WMA but is still weaker than prices.
- The weekly OBV (not shown) is below its WMA.
- The 20-day EMA and first support is at $202.60 with stronger in the $199-$200 area.
Next: Two More Major Averages to Watch
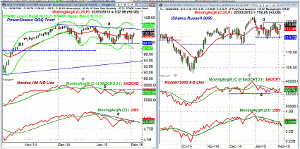
|pagebreak|The PowerShares QQQ Trust (QQQ) dropped down to test the quarterly pivot at $99.67 on Monday before closing strong.
- The upper boundary of the recent trading range is in the $104.58 -$105.26 area, line a.
- The daily starc+ band is at $105.46 with upside projections from the trading range in the $109-$111 area.
- The Nasdaq 100 line has moved back above its WMA with more important resistance at line b.
- The weekly A/D line (not shown) could move back above its WMA with a strong close this week.
- The daily OBV has slightly broken its downtrend, line c.
- It now needs to move above the January 23 high to confirm the breakout.
- There is initial support at $100.90-$102 with the monthly pivot at $101.68.
The iShares Russell 2000 (IWM) also closed strong on Tuesday and is just below the resistance at $119.45.
- There is more important resistance at the late 2014 high of $121.41.
- The daily starc+ band is at $122.21 with the weekly at $125.45.
- IWM gapped above the 20-day EMA at $117.46 on Tuesday.
- The Monday low at $114.38 was just below the quarterly pivot at $114.73.
- The Russell 2000 A/D line has again turned up from support at line e.
- It closed back above its WMA with next key resistance at the early January high.
- The weekly A/D line could close the week above its WMA.
- The daily OBV dropped below its WMA at the start of the year and has been drifting lower.
- The OBV is now just barely above its WMA.
The S&P 500 has gained over 50 points from last Friday’s close so as long as the S&P 500 does not drop 25 points or more in the next two days, an upside breakout is favored. I would not be surprised to a see some more choppy action before the market turns sharply higher.
How to Profit: No new recommendation.
Portfolio Update: A few minor changes from last time.
Traders are 50% long the iShares Russell 2000 (IWM) at $116.88 and 50% long at $114.96 with a stop now at $113.88. On a move above $119.50 raise the stop to $114.14.
Traders are 50% long the Spyder Trust (SPY) at $200.80 OB and 50% at $200.20 with a stop $196.57. On a move above $206.50, raise the stop to $197.38.


