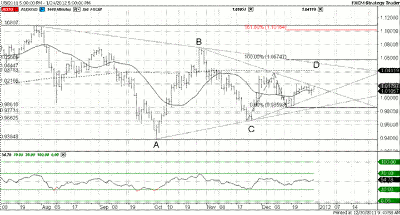
Chart patterns for the AUD/USD currency pair show potential for a move higher in the weeks ahead, but long term, the pair continues to form a major top in anticipation of a move below the October lows.
There are several interpretations of wave structure in the Australian dollar/US dollar (AUD/USD) currency pair from the July high (including a bullish triangle and bearish triangle as wave B from the October low), but most point higher over the next few weeks towards 1.0575 (100% extension of rally from 0.9663).
See related: Merits of Elliott Wave Analysis
Exceeding 1.0220 would inspire confidence in an upside bias. Until then, we could see a dip below 1.0045, while 0.9860 remains the key level for bulls. The 1.0100 level is short-term support.
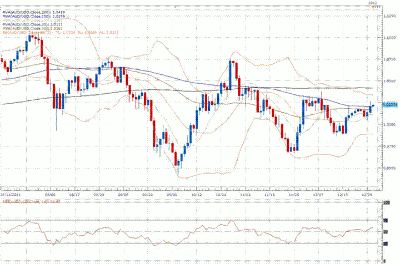
However, taking a look closer at the daily chart, any rallies are classified as corrective, and we continue to see this market in the process of carving out a major top ahead of the next downside extension back below the critical lows from October at 0.9385.
The latest bout of consolidation has been broken and it now looks as though a fresh lower top is attempting to establish by 1.0380. Look for an acceleration of declines from here towards 0.9660, which guards against the critical October lows at 0.9385. Ultimately, only back above 1.0380 would delay the outlook.
By Joel Kruger, technical strategist, DailyFX.com


