These guidelines for trading breakouts from support and resistance or trend lines work well in the forex markets, but are also easily applicable to equities, options, futures, or baseball cards, says Sam Seiden.
The key to profiting in any market is to have a simple strategy that has you buying low and selling high. The forex markets, in particular, are a set of markets that allow traders, on occasion, to buy high and sell even higher.
The strategy that offers us this opportunity is the breakout. While this is a strategy that has been around as long as trading, few traders understand the anatomy of what's really happening behind the scenes before, during, and after a breakout.
The forex markets are markets that move. In a market that has significant and consistent movement, using breakouts properly can be very appropriate. As with any strategy, there is a right way to understand and use the breakout and a wrong way.
See related: Forex Strategies: The Breakout Trade
Once you have breakout pattern recognition down, this does not guarantee success. Successful market speculators not only recognize profitable chart patterns, but they have the discipline and personality needed to follow rules. Not just any rules, but rules that give them a significant edge over the competition.
In this piece, we will discuss the two most popular breakout entries: support and resistance breakouts and trend line breakouts. We will also compare the traits of successful and unsuccessful traders.
Support (Demand) and Resistance (Supply) Breakouts
Once in a while, you'll hear someone say that breakout trading worked best in the stock market in the late 90's. Well, someone who learned to trade in the late 90's and does not understand breakouts might say that.
In those days, you could buy anything at almost any time and make money. Today, breakout trading is where you see most of the money being made in forex trading by those who truly understand the structure behind a true breakout; those traders are getting paid by those who don't understand.
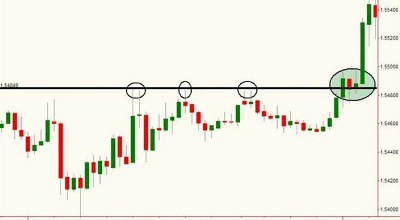
Take a look at the chart above. Notice the horizontal resistance line and let's work left to right in our understanding of what's really happening behind these candles in the chart.
The first circled pivot high on the left becomes that pivot high because supply in this market greatly exceeds demand at that price level. When price reaches the line, some of the sellers that make up that supply get to sell, but there is still much more supply than demand, so price has to fall.
The drop from that first circled area is significant, as we would expect. The next time price revisits that level, it declines again, but this time, the decline is shallow compared to the prior visit. This is because each time you revisit the level, more of the sellers that make up that supply get to sell, so the supply and demand equation is becoming more in balance.
The analogy here is the chopping down of a tree (not a great example for nature lovers like myself, I know). With each chop, you are removing mass from the tree, and therefore, the tree is more and more likely to fall with each chop.
In trading, the mass is the supply (sell orders) and demand (buy orders). Moving left to right, price comes back to that level a third time and falls, but again, the decline is shallow, suggesting that there is simply not as much supply at that level remaining.
See related: It All Starts with Supply and Demand
Next, price revisits that level a fourth time, but this time, instead of declining from that level, it bases sideways, suggesting there is no longer more supply than demand. This is when you get ready to buy because in forex trading (and any other market, for that matter), price is likely to move higher.
One would feel comfortable taking a low-risk entry on a breakout here because the objective price action tells us the supply and demand equation at that price level is flipping and that price is about to rise. This is a trade we see forex traders take in class all the time. This is also a trade you will see taken in our Extended Learning Track (XLT) - Forex Trading program.
Does every trade work? Of course not; that's trading. This is why it is so important to understand what is driving the movement of these candles. This, in turn, helps you understand structure of a breakout.
|pagebreak|One more important piece of information here is that the lowest-risk entry for this position is to let price break out a bit, and then buy on the retracement. For shorting, we would just do the opposite of what is being suggested here. If you want to see an example of a shorting opportunity just like this one, print the above chart and just turn it upside down.
The Trend Line Breakout
Trend line breakouts and breakdowns are a very popular entry in forex and other markets. Much of the time, this is the only type of entry forex traders use because they become comfortable with it since it is simple to understand and can produce some strong moves for a trader.
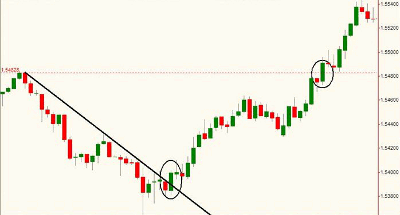
Let's again look at the chart above to explore another breakout scenario. The downtrend line is drawn once we have two points on a chart, which is what is always required when drawing trend lines. Once we have this, we simply draw the line and wait for price to breakout above the line for a long entry.
The logic here is that price is trending down because it is at price levels where supply exceeds demand. We want to buy this market when it reaches a price level where demand exceeds supply (more buyers than sellers). Instead of trying to guess where this might be, the price action on the chart will tell us this if we just wait and watch.
When price eventually breaks out above that downtrend line, it happens because it has reached a price level where there are more willing buyers (demand) than sellers (supply). This is where we would want to take a low-risk entry and buy.
While there are many profit targets that we cover in class, one logical target for profit is the origin of the decline in price that started the whole downtrend in the first place. This is shown as the dashed red line on the chart above.
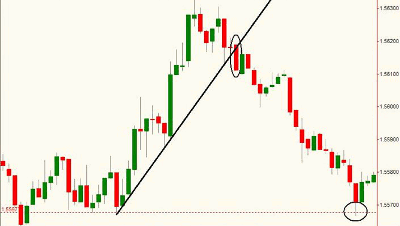
Here, we have a steep uptrend, as shown by the price action and our uptrend line. Instead of guessing where this dramatic advance in price might end, or at what price level the supply is, we can simply draw an uptrend line by connecting the pivot lows and look to sell short on a breakout (breakdown in this case) of that line.
As in the last example, a natural target can be the origin of that rally in price, as shown by the dashed red horizontal line on the bottom of this chart. Most importantly, the lowest-risk way to enter this position (or any position) is to short the first retracement after the breakout.
Now that you know your breakout patterns, would you like to know if you will be a successful trader or not? Let's look into your belief system and figure out what type of decision maker you are to find out whether you are likely to become a successful forex market speculator or not.
NEXT: What Makes Winning (and Losing) Traders
|pagebreak|Moves in markets are a result of mass psychology. We make money in the markets by being masters of human psychology and supply and demand. Winning and losing in the markets is more defined by your mental makeup than your trading style.
What is equally important to chart reading is to first understand how you think. Instead of focusing on changing your actions if you're having trouble with trading, it's time to notice where those actions come from. Actions stem from behavioral patterns, and behavioral patterns stem from beliefs. So, it's at the level of beliefs that decisions are made, and moreover, where your ability to differentiate reality from illusion resides.
It's time to start considering where your beliefs about what works and what doesn't in trading come from. In life, which includes trading and investing, most of us tend to repeat the same processes over and over, expecting a different result.
When you study the actions of traders, there are some very clear differences between the consistently profitable trader and the consistently losing trader. To know in advance before you start trading whether you will be a consistently profitable trader or a consistently losing trader, let's take a look at some of the traits of both:
The Novice (Consistently Losing) Forex Trader
- Do you tend to follow the crowd?
- Do you watch what others are doing?
- Comfort in numbers
- Do you avoid taking risk unless others are sharing the risk as well?
- Do you feel that if others are buying, then it is "OK" for you to buy as well?
- Do you act on the advice of so-called "experts," i.e., the advice of market gurus, CNBC, analysts, and your brokers?
- Do you tend to complicate the trading process and ignore the important simplicity of markets?
- Do you tend to complicate other things in your life?
- Do you make the same two mistakes consistently losing traders make: buying and selling after a move in price is well underway (late and high risk), and do you buy into resistance and sell into support (low probability)?
If you answered YES to any of the questions above, you might want to rethink your belief system before competing in the forex markets for profits.
The Consistently Profitable Forex Trader
- Leads the herd
- Tunes out all the subjective noise that can get in the way of making proper trading decisions
- Does not care what others are doing and makes decisions based on a very mechanical and unemotional set of criteria based solely on the laws and principles of supply and demand
- Knows how to identify the proper entry that most people never see
- Can identify opportunity before others
- Executes trading plans mechanically
- Has confidence, discipline, and patience
One of the most important things to understand about proper trading is that visible confirmation and low-risk opportunity are completely inversely related in trading. We don't have a crystal ball. Life would be easier if we did, but it certainly would not be as fun, and there is nothing more fun than a good challenge.
What we do have is experience and the ability to pay attention to what works and what doesn't. Those who can see clearly without the influence of illusion and weakness of mind will clearly see opportunities others never find.
Keep in mind that the most important part of trading is managing risk properly. The focus of this piece was to enhance your pattern recognition and your decision-making process. The breakout entries discussed are equally appropriate in any and all markets, so don't think this is just for forex.
Never forget, whether the candles on a screen represent a chart of stocks, futures, forex, options, football trading cards, rare coins, or anything traded, they simply represent people's perceptions and price.
We would quantify a breakout in price the same way in any and all of these markets. If you are watching the buying and selling of a Michael Jordan rookie card, and you see that the last one available at the current price level just sold, what is about to happen to price?
By Sam Seiden, instructor, Online Trading Academy


