Robert Sinn looks to short- and longer-term USD/JPY charts for important signals that indicate a major long-term trend change could now be underway in this popular currency pair.
Every so often a market that has been mired in a long-term downtrend or sideways oscillation undergoes a significant change of character which sets the stage for a potential change of trend.
Recently, on long-term charts, the Japanese yen (JPY) has looked like one of those markets.
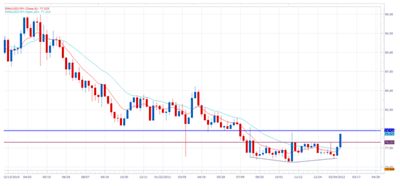
Back in late February, here is how the USD/JPY chart looked with a textbook inverted head-and- shoulders bottom and a measured move target of 79.75:
It was also especially significant because it was a previous level of major support. I believed back then that a weekly close above 80.00 would offer compelling evidence that the tide would turn for USD/JPY.
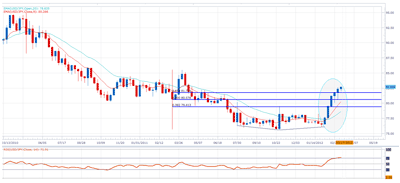
It indeed met that closing level, and since then, USD/JPY has steadily marched another 300+ pips higher, and sentiment on the yen has grown more bearish, though not quite bearish enough to mark a bottom. There are a few obvious targets above for USD/JPY: 83.90, 84.45, and finally the April 2011 high at 85.51.
The daily/weekly charts paint a powerful picture of a market that has bottomed and looks as if it wants to continue exploding higher.
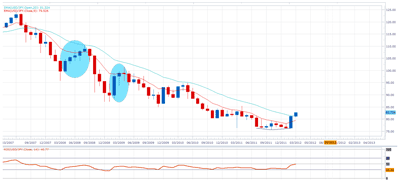
However, it would also be wise to examine the monthly perspective to see that similar rallies during the last five years have failed before:
Notice that the nine- and 20-month moving averages are beginning to turn higher, and USD/JPY is above its 20-month moving average for the first time in five years (when USD/JPY was above 120). This adds weight to the case that the bottom is in for USD/JPY.
See video: Is This the Turning Point for USD/JPY?
By Robert Sinn of RobertSinn.com


