Huzefa Hamid explains the pattern, a time-tested way to trade it in Forex, and a few corollary strategies.
Let’s take a look at the Pin Bar pattern and how it pinned the right entry last week on a trend line.
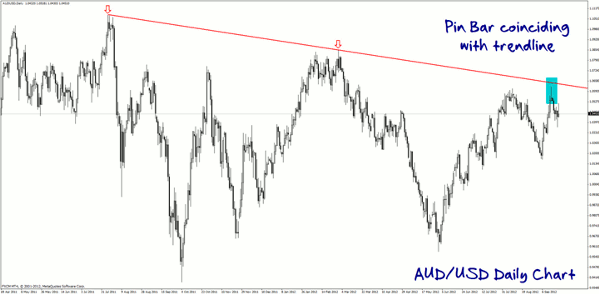
This is the daily chart on the AUD/USD pair. Here, I was focused on the price as it approached the blue trend line. If the price behaved in a “bearish way” as it approached my line in the sand, I’d consider a short entry.
As the price approached the trend line, it made a bearish Pin Bar (i.e. a bar where the entire body is at the bottom third of the candle). Now, it didn’t touch the trend line precisely—the high of the Pin Bar was about 25 pips below the trend line.
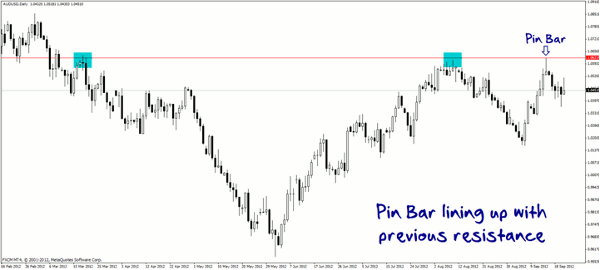
That said, on a daily chart and in the context of a trend line going back several months, 25 pips is not a lot. And you can judge this distance (or lack thereof) visually on a chart. It’s also worth noting that the high of the Pin Bar tied in with several points of previous resistance, within ten pips:
Next: When learning basic trading concepts...
|pagebreak|When learning basic trading concepts, you may have come across the term “confluence.” In trading terms, confluence means bringing several factors together in a setup, rather than relying on any one single item to enter a trade.
Let’s look at this setup in terms of confluence. A Pin Bar by itself gives a bullish or bearish bias. But by itself, it does not mean we should just jump into a trade. Similarly, price being near a trend line or a previous support/resistance level gives us directional bias, but by themselves they may not necessarily be enough to enter the market.
But with this trade setup, I believe we reached an acceptable level of confluence to say to ourselves, “Hey, there is enough going on here telling me that the price is very likely to fall. First, there’s a trend line above and the price seems to have bounced off it. Second, the daily candle has produced a bearish Pin Bar. And thirdly, the resistance level the Pin Bar has formed at its high matches previous resistance levels. I think given all that, in all likelihood the price is going to fall.”
In this trade, assuming an entry at the close of the Pin Bar or the open of the next bar, and a stop-loss at the high of the Pin Bar (about 75 pips), you would have seen a 1:2 risk-reward ratio (150 pips profit) being hit within a few bars (i.e. a few days).
When the trade went into profit, you could have managed it in several ways: at 1:1 risk/reward, you could have simply taken your profit. Or you could have taken some of your trade off the table and left the rest to run. And if you left some of your trade on, you could have moved your stop-loss to breakeven.
If you’re still in the trade, you would notice another bearish Pin Bar produced that has bounced against the 61.8% Fib level (at the time of writing this article) that could lead to further downward movement:
Certainly at this stage, whether or not you’ve taken some profits, you’d want your stop-loss at breakeven at the very least. To allow a trade to have gone so far in profit yet turn into a loss would not be intelligent.
As a final note, let me reiterate that even with confluence, you are looking at the “likelihood” of price falling. It is by no means a guarantee. Therefore, you still have to trade with a stop-loss and risk a sensible percentage of your account on the trade.
In summary:
- A Pin Bar gives a bullish or bearish bias to start looking for a potential trade entry.
- When you have several factors that align with a setup such as a Pin Bar, you have “confluence.” Confluence increases the probability of your trade succeeding and hence your win rate.
- Even with strong confluence, you are not guaranteed to win a trade. You still have to trade with a stop-loss and money management rules.
Huzefa Hamid is co-founder of TheForexRoom.com.


