Tyler Yell of DailyFX.com explains how to stay in a strong currency trend using an indicator that is growing in popularity among active traders.
Have you been frustrated when after closing out a trade, you see the currency pair continues in the direction of your trade for another 100 pips? You’re not alone. This happens to many traders. This article will show you how a lesser known indicator, the Heiken-Ashi, can help you stay in strong trends.
Though our online courses, we can tell traders are consistently frustrated with seemingly arbitrary market movements. Often we are asked the best place to exit a trade. This frustration may be the lack of a trading plan. With a trading plan in hand, a trade can approach the market with confidence.
Every battle is won before it is ever fought.
-Sun Tzu
We ran through 12 million live trades at FXCM to find what distinguished successful from unsuccessful traders. We found consistently that traders losing money often held on to their losing trades much longer than their winning trades. This is symptomatic of a lack of confidence in their plan and specifically the trade they are currently in.
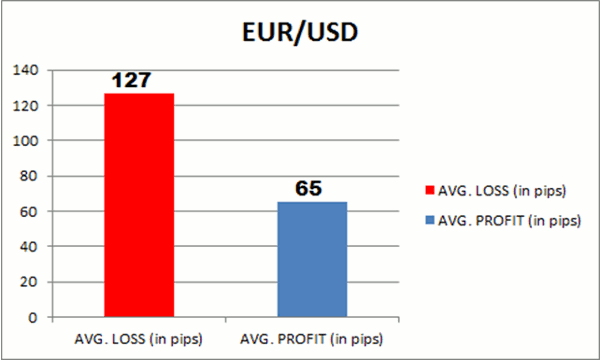
As an example, when looking just at EUR/USD trades over the year, we found our clients were closing out their losing EUR/USD positions at a 127 pip loss. On a relative basis, this was almost twice their average profit of 65 pips.
The same lack of confidence in their trading plan caused people to close out trades early. When we scaled out our research over all pairs, the average profit was 52 pips. This is nearly half the average loss which shows traders are closing out their winners quicker.
The solution to this problem is an indicator called the Heiken-Ashi.
Heiken-Ashi modifies the traditional Japanese Candlestick by sending the open and close through a calculation of the average. This creates a new candle on the chart that many would say is easy to read.
NEXT: How to calculate the Heiken-Ashi formula
|pagebreak|The calculation is simple and you will notice it only affects the open and close of the candlestick:
Heiken-Ashi formula:
- Close = (Open+High+Low+Close)/4
- Open = [Open (previous bar) + Close (previous bar)]/2
- High = Max (High,Open,Close)
- Low = Min (Low,Open, Close)
Two benefits of the Heiken-Ashi are the direction of the trend and trend strength.
The first benefit of Heiken-Ashi is showing you the direction of the trend through color coded candles. The blue candle is showing you the trend is up. The red candle will show you the trend is down.
The second benefit of Heiken-Ashi is that it also indicates the strength of a trend. You will notice that many of the candles do not show a wick in the opposite direction of the trend.
This lack a wick is a result of the calculation above to indicate the average price moving in the direction of the trend. So when you see no wick, that means you’re in a strong trend.
When you’re in a trade and you’re unsure of whether or not to exit, consider the Heiken-Ashi candle wick. If the Heiken-Ashi continues to show the trend moving in your favor that is strong then you can confidently stay in your trade.
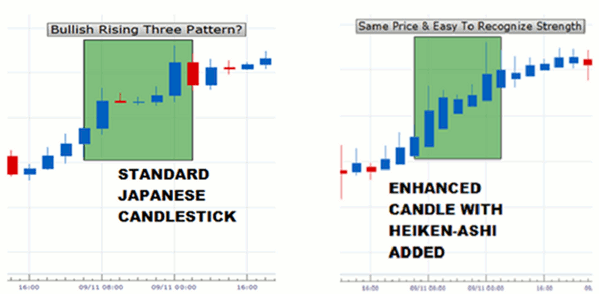
For example, you’ll notice a trader using standard Japanese candlestick (left side) may get confused during congestion and possibly exit the trend. With the Heiken-Ashi (right side), by virtue of the blue candle and no wick to the downside, they can confidently stay in their buy trade. This allows them to stay in a strong trend longer.
Tyler Yell can be found at DailyFX.com.


