Traders should look to match their strategy with the appropriate market condition, says James Stanley of DailyFX.com, and here he shows how traders can begin to develop their own trend-trading strategy.
To anyone trading in markets, it’s often advisable to have a strategy of some type to go about doing it. After all, just “guessing” isn’t likely going to work out too well for anyone speculating in markets over the long run. Having some idea for the type of situation one is looking for can be extremely helpful. With a strategy, traders can look to focus on situations in which the market may be giving them the best probabilities of success.
After discovering the necessity of a strategy, traders will often go on to seek the “best” strategy that they can find. This can be an elongated process for some folks, as many traders are often looking for something that doesn’t exist: They’re looking for the strategy that rarely (or never) loses.
This just doesn’t exist.
Regardless of how strong a strategy ever might be, it will never be 100% predictive of market movements. The future is opaque with or without a strong strategy. A good strategy can simply allow the trader to focus on higher-probability setups and situations in an effort to win more money than they lose; so that they may be able to net a profit.
Markets will often exhibit one of three different conditions, and traders are often best served by matching their strategy with the appropriate market condition. In this article, and the next two we will examine each of these three conditions in more depth so that traders can decide how to more adequately formulate their strategies.
In this article, we’re going to focus on the most popular condition: Trends.
Trend Trading
Of the three possible market conditions, trends are probably the most popular amongst traders; and the reason for that is what we had alluded to a little earlier.
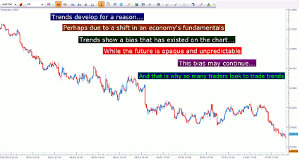
The future is opaque, and price movements are unpredictable. By simply recognizing a trend, the trader has noticed a bias that has shown itself in the marketplace. Maybe there is improving fundamental data for that economy; or perhaps it’s a central-bank driven move on the back of “yen-tervention” or another round of QE.
Trend Trading

Created with Marketscope/Trading Station II; Prepared by James Stanley
Click
to Enlarge
Whatever the reason, a bias exists in the market and that’s visible from the trajectory on the chart. The alluring part of this is that if that bias continues, the trader might be able to jump on the trend, and let the market do the heavy lifting of moving the position into profitable territory.
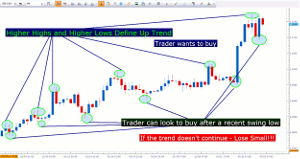
Another attractive aspect of trading with trends is that the speculator can look to employ the age-old logic of “buy-low, sell-high.” It’s not enough to simply buy an up-trend, or to sell a down-trend. Traders are often best served by waiting for the up-trend to pull back before buying (or waiting for a down-trend to rip higher before selling), in an effort to enter the position as cheaply as possible.
This way, if the trend doesn’t continue, the trader can exit the position quickly before the loss becomes too unbearable. But if the trend does continue, the trader might be able to profit by three, four, or five times the amount they had to initially risk to enter the trade. This is a non-threatening way that traders can look to avoid the number one mistake that FX traders make.
How to Build a Trend Strategy
Many of the most popular indicators can be helpful when designing a trend strategy. And to take technical analysis a step further when designing a trend-trading approach, many traders will look to utilize multiple time frame analysis in order to get multiple looks at a trending market.
NEXT PAGE: Types of Trend-Trading Strategies
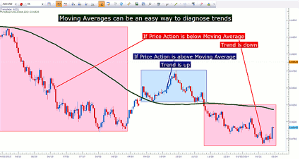
|pagebreak|When utilizing multiple time frame analysis with a trend-trading strategy, traders are often going to look to the longer time frame to find and diagnose the strength of the trend. This can be done in a multitude of ways. Some traders will prefer to do this without any indicators at all, using price and price alone (the study of which is referred to as price action).
Other traders will look to one of the more common indicators, the moving average. There are a lot of different flavors and types of moving averages, but the goal is all the same—to show us a “line-in-the-sand” as to whether price movements are “above-average” or “below-average” for a given period of time.
Moving Averages Can Help Traders Diagnose and Trade Trends

Created with Marketscope/Trading Station II; Prepared by James Stanley
Click
to Enlarge
After the trend has been diagnosed, the trader can then plot the entry into the position; and for that, there are a multitude of options available.
Entering into the Trend
There is an old saying that goes: The trend is your friend… until it ends.
This one line pretty much sums up the quandary that traders are faced with when trading trends. While a bias has been exhibited in the marketplace, and may continue; there is no such thing as a sure-fire trend continuation setup.
So, when the trend doesn’t continue, the trader is often advised to look to mitigate the loss so that a reversal doesn’t damage their trading account too badly.
In an effort to be as precise as possible, many traders will move down to a lower time frame in an effort to get a more detailed look at the move inside of the larger-term trend.
Some traders will use price action to enter on the lower time frame, in anticipation of the larger-picture trend continuing.
Price Action Can Help Traders Diagnose and Trade Trends
Traders can also look to use indicators to plot an entry, under the premise that the longer-term trend may be at the early stages of its continuation; and can be entered upon with the shorter-term chart.
There are numerous indicator options for this premise. Many traders will look to oscillators such as RSI or MACD to trigger the position. Other popular options are stochastic, CCI, and the moving average crossover.
Traders looking to speculate with the trend want to focus ONLY on signals that move in that direction.
So, for instance, if an up-trend has been found on the longer-term chart, then the trader is only looking to buy. If they are looking to sell, then it’s not a trend-trading strategy any longer as the trader is looking for a reversal (or a swing) that doesn’t agree with the longer-term trend direction.
Types of Trend-Trading Strategies
We talk a lot about trend-trading at DailyFX, and one of the primary reasons for this is that it is one of the more clean ways to utilize a trader’s analysis into a trading plan.
After all, the future is unknown; and nobody has a crystal ball that will magically foretell tomorrow’s price movements. But the fact of the matter is that biases do exist, trends do take place (for a reason), and in many cases those trends may continue.
Price and price alone is often enough to show traders what they need to see to decide when and how they want to enter trades in the direction of the trend.
If traders want a more objective way of trading with trends, they can look to implement an indicator like RSI to trigger the position after the trend has been graded on the longer-term chart with price action.
Traders looking to use indicator-based strategies can take this a step further with the logic utilized in my “fingertrap” scalping strategy. In the strategy, moving averages are used to grade the trend on a longer time frame, and a moving average/price action crossover on the shorter time frame is used to trigger in the direction of the trend. While this is designed as a scalping strategy, traders can certainly swap out the time frames with those suggested in the time frames of trading to make the logic of the strategy operable on a longer-term basis.
By James Stanley, Trading Instructor, DailyFX.com


