
Monthly and weekly time frame analysis can help establish trend structure and direction while daily is used to decipher the bias, so Zaheer Anwari, of TheTradersCosmos.com, takes a technical look at this currency pair over three time periods.
The EUR/USD has been a simple trend trade to profit from once the bears took control of the market at the major resistance of 1.4000 in May 2014. In this article, I will explain how, as a trend trader, I used multiple time frames to establish an entry and then how price action has dictated to hold my compounded-positions through the turn of the New Year.
Time Frame Structure
I am a long-term trend trader. I look to hold my position for weeks to months. For that reason, I use the monthly, weekly, and daily time frames in unison with each having its own purpose. The monthly and weekly time frames help to establish trend structure and direction while the daily is used to decipher the bias as well as for entry and exit management.
The Monthly Time Frame
The monthly time frame is used to show clear levels of support and resistance. The plotted pink lines represent the high, the low, and the closing price of previous years. The distance between these lines will tell us if price had been in a trend or in consolidation in that year. As part of my routine analysis, I look at only the previous year's pink lines but have plotted all of them on the chart for visual purposes.
(NOTE: As we are now in 2015, the pink lines of 2014 are the levels of support and resistance that we take into consideration. At the time of my first entry on the EUR/USD, it was, of course, 2014. The pink lines of 2013 were in play.)
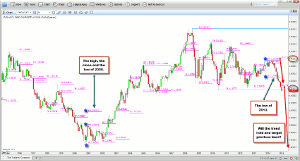
Click to Enlarge
The structure of price on the monthly EUR/USD chart shows that it has been in a wide consolidation dating back to 2008 between the round numbers of 1.6000 acting as resistance and 1.2000 acting as support. This is a range of 4000 pips which allows for profitable trends to be established. A much narrower range-such as that on the GBP/CAD since January 2014-is where trend traders stand aside and wait for a breakout and a trend to be established. The monthly chart also shows how price reacts to round numbers. They create pivot levels and are good target levels when price is trending. They can be points of reversal or, if broken, signal a continuation of the trend to the next round number. Since price found resistance at 1.4000, price has continued to create lower lows, making light work of support levels including 1.3000 and the low of 2013. Current price action shows price has broken through the major support level at 1.2000 and the pivot level of 2010. We now need to apply patience and wait for price to close below this level to confirm a new low. If this does happen, we can then expect price to target 1.1000 as the next support level. Price has been as low as 0.8000 dating back to 2002. The past is not a guarantee but it is a good indication of future price action.
(NOTE: Support and resistance levels are not hard levels but zonal areas. The pivot levels of 2009 and 2011 at the figure 1.5000 are good examples.)
NEXT PAGE: What Equals Success in Trading?
|pagebreak|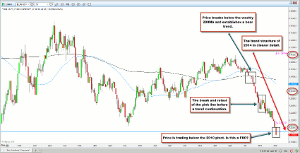
Click to Enlarge
The Weekly Time Frame
The weekly chart above is used to establish where price action is in relation to the weekly 200MA and the weekly 50MA. Both are areas of support and resistance. When looking to trade a bear trend, we ideally want price to be trading below both these moving averages.
Making money from trading involves patience. I came across an excellent quote on Twitter the other day that sums this up very nicely:
"Success in trading = 90% Waiting + 10% Trading. " - P. Johnson from StockConfidential.com
This is very true as less is very much more in trading but it takes time and experience to really appreciate this.
Applying this to the EUR/USD, price found resistance at 1.4000 in May 2014 but it was not until August 2014, four months later, when price had broken through both the weekly 50MA and weekly 200MA that this pair started to pique my interest as a trend trading opportunity.
Click to Enlarge
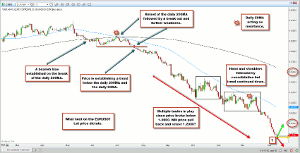
The Daily Time Frame
The daily 200MA is used to give trend traders a bias in price action. When price is trading above the daily 200MA, it has a bullish bias where I limit entries to long opportunities. When price is trading below the daily 200MA, it has a bearish bias and this is where I limit entries to shorting opportunities. Price broke below the daily 200MA in May 2014 putting this on the radar as bias and trend direction were now in sync.
A little more patience was required as we needed further support levels to be broken before allocating risk on a short entry. In September 2014, we were rewarded for our patience as price broke below the weekly 200MA, the pink line low of 2013 and the round number 1.3000 and it had continued to remain below the daily 50MA. Since then, price has gone on to offer multiple entry points which have remained open since September 2014 and through the turn of the New Year. The bears have repeatedly created new lows since the start of January 2015 adding good profit to these open positions. The art to trend trading is holding your positions without second-guessing a reversal during periods of correction such as the head and shoulders pattern in October 2014 and the consolidation through November 2014 and December 2014.
Exit Management
Price now sits in an interesting position. It has just broken a major support level and Friday is the release of NFP. In addition, price action never moves in a straight line. After every move, we expect a flag (or pull back) and we are due one since the last pull back at 1.2200. We also expect a retest of the figure 1.2000, which is now resistance. The difficulty with pullbacks is not knowing how far price will pull back to. We can assume certain levels but ultimately price does what it does. The first level of resistance is the round number. I have tightened my stops to lock in the majority of the profit made but have left room for the pullback to occur. If price finds resistance at 1.2000 and bounces to the down side then my open positions will remain intact and I will accumulate further profit. Any deeper and I will get stopped out for very good profit. If that is the case, I will then look to re-enter on the next set up.
The EUR/USD in 2015
Considering how price is currently set up, there are three scenarios that could take place:
- The break out below 1.2000 could be a fake break out and price could reverse back into the long-term range and go into consolidation.
- Price could do a swift turn around, break above the daily 200MA, and establish a bull trend.
- The trend could continue to new lows targeting 1.1000 and beyond.
It is impossible and unnecessary to try and predict what will happen next. It is far simpler to let price dictate what course of action to take. As a trend trader, I am from the school of thought that the trend is your friend and so favor the third option of a trend continuation. However, until price confirms that by plotting lower lows, I have my stops in play and profit protected. It will be interesting to see how price action pans out through 2015.
Remember, keep it simple and always trade what you see and not what you think. Let price be your main indicator.
By Zaheer Anwari, Founder, TheTradersCosmos.com


