
A few months ago, I wrote an article where I looked at the current valuation of the market, and some areas that looked relatively attractive on a valuation basis within it; since then, a lot has changed, asserts Jack Forehand, market strategist and editor of Validea.
Although the market has continued its run upward, the pace of its rise has slowed somewhat. We also now have another quarter of earnings that have been reported, and results were strong, with the economy in rebound mode. And the big run up in value stocks has hit a snag in the past couple of months as growth has re-asserted its leadership.
With all that has changed, I thought it would be a good time to revisit our market valuation tool to see where the market currently stands from a valuation perspective and the current state of the spread between value and growth.
But before I do that, I wanted to first cover two caveats I always put in articles about market valuation. The first is that market valuation has essentially zero predictive power over short-term market returns. So the fact that the market is expensive (or cheap) tells you nothing about what it will do in the next year.
Where valuations can have some predictive power is in providing an indication of the long-term returns we can expect. Above average valuations typically lead to below average long-term future returns and vice versa.
The second caveat is that we use median figures when we look at market valuation. A median is calculated by simply ranking all stocks based on each valuation metric and then selecting the valuation that ranks right in the middle of the distribution.
Since our models select from a universe of all stocks, we like to use data that looks at the valuation of the average stock in that universe and how that changes over time. But this type of data offers no value in looking at the valuation of market cap weighted indexes like the S&P 500 or the market as a whole.
For those types of indexes, the large companies are much more important to their valuation than the small ones, so median data is not useful. With that all being said, on to a look at the current valuation data.
Here is the chart of the median TTM PE for our investable universe (about 2800 companies) from 2006 to the present.
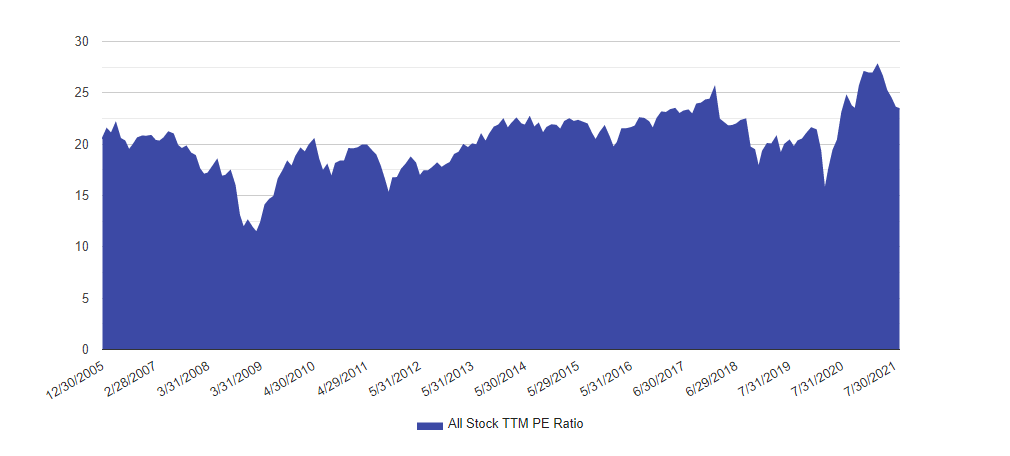
One thing that might surprise you from the chart is the fact that the PE ratio has actually fallen despite the market’s continued strong run. To understand why that has happened, it is important to keep in mind that a PE ratio has both a “P” and an “E” in it. And in this case, the “E” has been improving with the overall economy, which makes stocks cheaper.
We are still in the 90th percentile, so the market remains expensive, but that is an improvement over the last time I wrote about this three months ago when the market was in the 97th percentile.
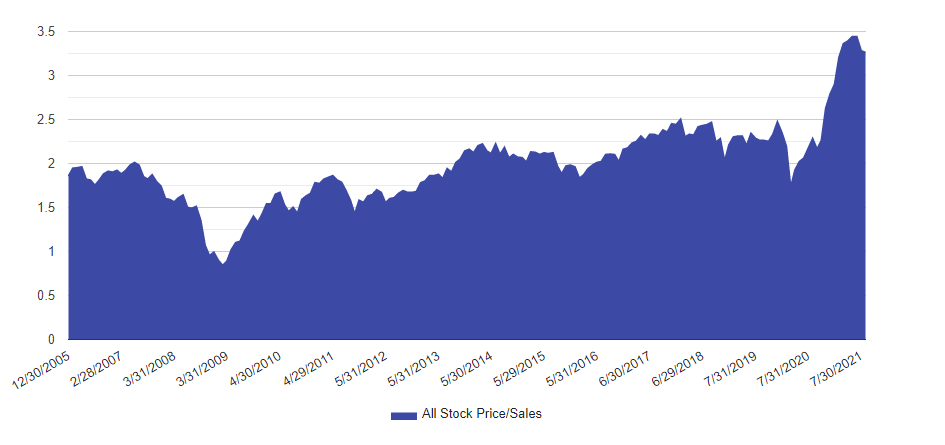
When you consider the fact that taxes and interest rates are at historical lows and margins are high, you would expect the market to be more expensive based on sales than earnings, and that ends up being the case.
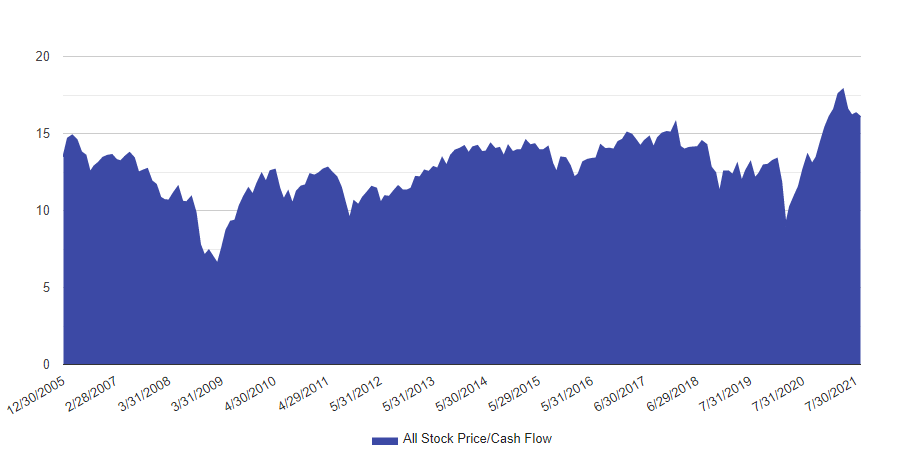
The valuation using Price/Sales has not fallen nearly as much as the Price/Earnings based valuation, and we remain in the 97th percentile. Price/Cash Flow paints a picture similar to Price/Sales, with a valuation currently in the 96th percentile.
So the overall conclusion is that valuations are still very high, but have improved slightly in the past couple of months as a result of improving earnings.
Is the Value of Value a Value?
When I last looked at the relative valuation of value stocks, they looked attractive on a relative basis when compared to growth stocks, but not as attractive as they had been at the bear market bottom in 2020. And that made sense given the big run they had in the year following the bottom.
On an absolute basis, the big run in the market had taken them from very cheap to fairly expensive when compared to their own history. Let’s take a look at what has changed since then.
First, on a relative basis, value is back to being almost as cheap as it was at the market bottom.
There are two major reasons for this that get back to what I talked about earlier in the article. First, value companies have seen significant earnings growth. Second, growth has outperformed value in the past couple of months, which has resulted in an expansion of the valuation gap. On a relative basis, value still looks very attractive.
On an absolute basis, things have also improved, with earnings growth being the primary driver.
The absolute valuation of value stocks (which we define as the cheapest 20% of our database) based on earnings is back to below average levels, after rising to above average levels when I wrote my previous article.
But based on Price/Cash Flow, valuations remain above average, despite some improvement recently.
The Limitations of Valuation
All of us have a tendency to look at data like this and draw short-term conclusions. But as I mentioned earlier, absolute and relative valuations offer almost no value in predicting short-term market movements. But they can be useful in looking at the likely range of future long-term returns and how they evolve over time.
By that standard, our data echoes data from many other sources that has shown that the market is expensive and value stocks are cheap, at least on a relative basis. But when the forces of mean reversion will correct either of those is anyone’s guess.


