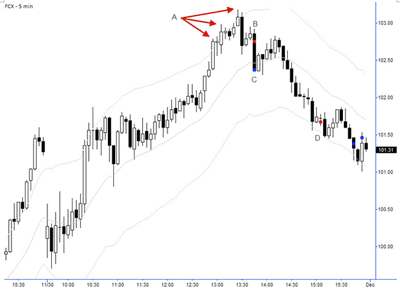
As many of you who read my blog and follow us on Twitter know, we have been very focused on Freeport McMoran Copper & Gold (FCX) for the past several days.
This stock has a well-earned reputation for being difficult to trade, but when it is really in play with good order flow, it actually behaves itself pretty well. I tend to focus on with-trend trades, and encourage the traders who I mentor to do the same for many good reasons. It is very easy to get caught up fading stocks because you think they have gone too far (or if you’ve read some books on technical analysis, you have a better way to say it: “Overbought” or “oversold”), but the reality is that stocks can get overextended and stay overextended while they trend a lot further than anyone expected. Traders fading into these moves have to deal with anger, frustration, and mounting losses, and save enough bullets so that they can really lay into the stock when they finally catch the turn. It’s a lot to ask and a hard way to make a living, especially when there are much easier ways to sell the top or buy the bottom.
First of all, realize that we are not going to sell the exact high of the move or buy the low, except on that one trade out of a hundred when we just kind of get lucky. What we need to do is to see signs the trend has ended, watch for the very first signs that the tide has turned and is now flowing in the other direction, and then enter in the direction of the new trend. I have written before about three pushes or three drives to a high, which is one of my favorite trend-ending patterns on all time frames. (If you haven’t seen this one before, I know it seems absurd. Keep an open mind and watch for it for a few months and let me know what you think then.)
So we were watching FCX midday, and Joe P (on twitter as JoeP_SMB), who sits beside me on the trading floor, made some long trades in FCX earlier in the day. I was halfheartedly involved in them, but didn’t really feel the conviction, so I was very aggressive in calling out the three pushes top I saw (marked A) on the chart below. This pattern alone is not enough to get us short, especially a stock like this that is more than happy to run you over if you’re early on an entry, so we then waited for the first countertrend break and shorted on the retracement marked B on the chart below. I took partial profits on the blue dot, added to the trade later in the day (for several reasons), and covered the last of my short into the close. Considering how difficult this stock can be, this was a very easy, painless trade which got us short less than half a point from the high of the move and let us ride the new downtrend all the way to the close.
There are a few subtle refinements to this trade, but this pattern occurs over and over, in all markets and in all time frames. Do some chart study, practice identifying the pattern in real time, and see if this can become a valuable addition to your playbook.
By Adam Grimes, trader, SMB Capital


