
There is a tool that, in my opinion, is one of the best ways to gauge the health of the markets, whether it is set up for a run higher, or whether there is weakness on the horizon. As it stands right now, the market is primed to continue its march upwards, which means that we're likely to see a move into the 1270's and possibly in the low 1300's. Of course, that is pure speculation, and I'll have to let price confirm that move for me, but as it stands right now, I have no desire or reason to be loading up on short positions in this market.
Here is my market health tool: The NYSE Reversal Indicator:
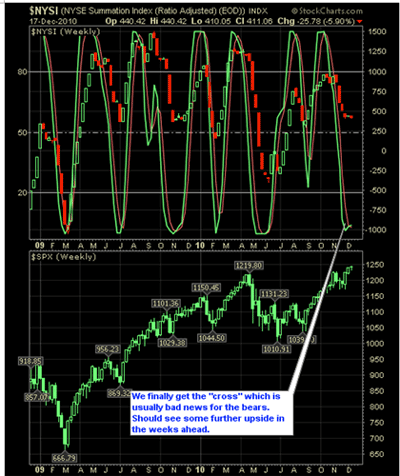
Click
to Enlarge
For those of you who are not familiar with this chart, here's a quick tutorial:
The indicator uses the Advance/Decline ratio with a stochastics overlay. The bottom half of the chart is the weekly candles of the S&P. The chart itself goes back two years. Some folks have criticized me for posting this chart in the past, saying that it isn't 100% accurate, but if it was, as some think it must be, then I wouldn't be posting it—I'd save it all for myself and make an ungodly sum of money off of it. But it isn't perfect, and there is always a level of error that you can expect from it.
But overall, it is fairly accurate, and when the indicator hits certain extremes on the stochastics, it is often a good time to start hedging positions that are going against the direction of the indicators, or start loading up on short or long positions in line with the direction that the indicator itself is pointing.
Remember, the extremes are where you want to pay the closest attention, particularly where the %K and %D lines cross (i.e. the red and green lines). This is a stochastic indicator and is a price oscillator consisting of two lines (percent K and percent D) that move either up or down with upward and downward movements in price, respectively. The two lines oscillate between zero (signifies the bottom) and 100 (signifies the top).
This is typically where we begin to see changes in the behavior of the market—not always, but quite often, and enough to warrant our attention. What this tool is best for—in terms of what I use it for—is market timing and position building. When there is a crossover at one of the extremes that goes against the positions in my portfolio, I often times look to take profits in those positions or at least hedge against them.
By Ryan Mallory of SharePlanner.com


