
Recent price action in the gold futures market offers a classic example of a reliable short-term reversal set-up that works equally well in a variety of other markets.
Intraday traders had a great example of the “three-push” pattern complete with multi-swing negative divergences into an overhead round-number resistance level in gold.
Let’s take a look at how the classic pattern set up and learn the important trading lessons from this recent event:
Click to Enlarge
First, let me say that reversal-style trades (like this) are inherently greater in risk than standard retracement trades (like flags), but some traders just can’t resist going for that golden reversal—especially on the intraday frame.
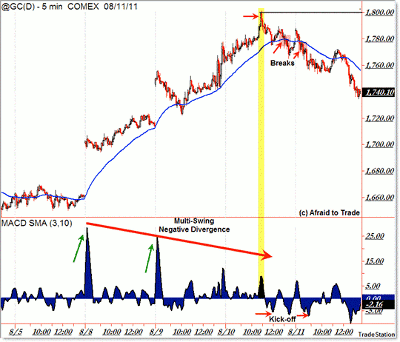
Gold has been powering higher after breaking firmly above the $1,550 and $1,600 reference levels.
If you can’t resist reversal trades, then you should learn the “three push with divergence” set-up.
This is a classic set-up with a modern twist. Price has a tendency to exhaust itself after three symmetrical swings, or “pushes,” in price, as we can see above.
Push #1 was on the gap open of August 8; Push #2 was (not surprisingly) on the gap opening on August 9; and Push #3 was the sustained price swing into the $1,800 level on August 10.
A three-push pattern is similar to your classic price patterns such as bull and bear flags, head-and-shoulders, and triangles, all of which need no outside indicator references to spot in real time.
See related: Chart Patterns Every Trader Should Know
Of course, indicators and volume readings are helpful, especially if you’re anticipating a short-term reversal.
Article Continues on Page 2
|pagebreak|A good three-push reversal pattern should be accompanied with negative momentum and volume (not shown) divergences into the final swing high.
It’s even better if the pattern forms into a prior resistance level or a round number like $1,800, as happened here.
Click to Enlarge
Using the 3/10 momentum oscillator, we see a decline in the momentum peaks/highs on each of the three pushes, which resulted in the lowest oscillator peak into 11:00 am when price pushed into the $1,800 pivot.
Very aggressive intraday traders can short into the $1,800 resistance, but price has a tendency to run just a bit beyond simple round numbers at times.
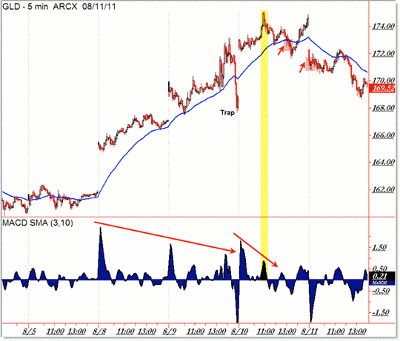
Though you can’t see it in the scaling of the chart above, gold futures ran overnight to $1,815 (the SPDR Gold Trust (GLD) did not make a higher high beyond the August 10 high).
Here is the same chart—although choppier—in the popular gold ETF GLD:
Click to Enlarge
While aggressive entries short into resistance, conservative entries short on a breakdown of a rising trend line, exponential moving average (EMA), or similar price reference level after price begins falling from expected resistance.
Volatile markets tend to call for wider stops and wider targets than normal. Though $1,800 was the daily peak, the overnight session took gold to $1,815 before reversing on this day.
Ultimately, the three-push reversal pattern with divergences set up the day’s negative session in gold, which corresponded with the increase in margin requirements that historically have driven futures prices lower on their announcement.
Article Continues on Page 3
|pagebreak|Reversal set-ups are quite risky but do have their place in the experienced traders’ toolbox. Study this example for additional insights in the risk/reward of three-push patterns with divergences.
And here is an additional trading example of how to piece together the chart puzzle into a successful low-risk, high probability trade on the very short-term structure.
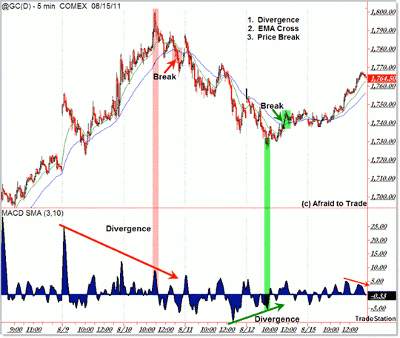
Let’s take a look at a recent short term chart of gold back on August 8 - 15:
Click to Enlarge
The main idea was that price rallied into the key overhead “round number” of $1,800 per ounce on lengthy (multi-swing) negative momentum divergences.
Very aggressive traders like to short sell into higher-time-frame resistance, particularly if some sort of divergence (momentum, volume, etc.) is present. It’s a low-risk trade in the context of a potential short-term reversal (or at least retracement) against the resistance.
Conservative traders prefer to watch the set-up develop and then take a position after price triggers/signals entry on a corresponding price trend line or EMA (moving average) break/cross.
When you’re playing this type of set-up on the short time frames (intraday like the five-minute chart above), the common question becomes:
“I see where I put on the trade, but where do I exit?”
Let’s keep it simple and discuss the answer:
“When price—in real time—gives you a similar reversal signal.”
Of course, an alternate method would be playing for a specific price or percentage-gain target (such as $1,750 or $1,700), but let’s take it a step beyond super-simplicity (price level targeting).
If you’re playing a short-term reversal signal, try holding the position until price gives you a similar counter-reversal signal in real time.
Admittedly, this isn’t as comfortable as trading with a specific target in mind, but it can help you generate a higher potential profit if the price swing has more power in it that takes it beyond a simple price level target.
In this case, let’s assume that we entered short at the red highlighted region which played off the negative dual divergences and inflection down from $1,800 that triggered an entry on the break of the $1,780 region which soon-after resulted in a 20/50 EMA bearish cross-over (August 10th).
We would place our stop-loss above the chart swing high at $1,800 and then play for an indefinite target until price gave us a reversal signal.
Price reversed its trend with a series of sequential lower lows and lower highs (price structure) which eventually resulted in a clear positive multi-swing divergence into the spike to $1,730 on Friday, August 12.
Divergences are not flip-reverse position signals by themselves, but they can be position-exit signals for conservative traders (exit a profitable position into a clear positive momentum divergence with price).
Alternately, a trader can see the divergence but then demand that price break a falling trend line or EMA, which would serve as a trend-reversal trade-entry position—similar to the signal generated at the $1,780 short-sale trigger.
The price confirmation (breakthrough signal) occurred at $1,740, which triggered a reversal entry signal, and of course, an exit signal for any remaining short-sale position.
The process starts over again with a reversal buy signal at $1,740 with a stop-loss now under the $1,730 swing low.
In Conclusion
To summarize, “Let Exit Logic Equal Entry Logic.”
If you’re entering a short-term reversal trade with divergences, hold the position until price generates a similar reversal signal in the opposite direction.
Also, it’s worth reviewing the trigger tactics for the Divergence + Price Break trade:
- Observe a multi-swing divergence
- Trade when price breaks through (confirms) a trend line or key EMA (20 or 50 period)
- Observe the confirmation with a 20/50 EMA crossover
Remember that this is one of many trading strategies, but it’s worth studying if you’re not familiar with the concept.
Though I’m using gold as a teaching example, this principle tends to work just as well in stocks, ETFs, or other futures markets.
By Corey Rosenbloom, trader and blogger, AfraidToTrade.com


