We build on last week’s lesson with a real market example of a “creeper trend,” a formation which is often difficult to identify and trade, thus requiring certain adaptations on the part of traders.
Previously, I explained what a “creeper trend” is, how it develops, and—if you’re willing to feel uncomfortable—how to trade it carefully (it’s not your typical trade set-up).
I wanted to follow up that lesson with a great example of a creeper trend formation (trade entry), trend reversal (with excellent positive momentum divergence example), and re-formation of a creeper trend in the opposite direction.
While this is your standard trend reversal example, I wanted to take it a step further and explain it in terms of feedback loops and creeper trends, which are important but often misunderstood concepts.
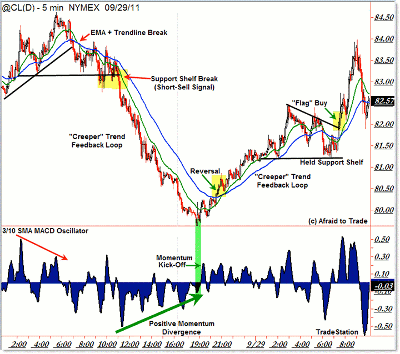
Let’s start with the five-minute “bigger-picture” structure of crude oil at the end of September 2011:
For simplicity, we’ll focus on two main lessons:
- The creeper trend move (see my MoneyShow.com article about lessons on Creeper Trend for detailed explanation)
- The reversal of the creeper trend on clear (lengthy) positive momentum divergences
The goal is to empower you to spot (and understand) a creeper trend in real time and then trade in the direction of the creeper trend until a clear reversal signal develops (and what that signal is).
NEXT: Learning to Identify a "Creeper Trend"
|pagebreak|Starting at the top left of the chart, price formed negative momentum divergences, broke under a rising trend line along with the 20- and 50-period exponential moving averages (EMAs), and then formed a “support shelf” above $83.00 per barrel.
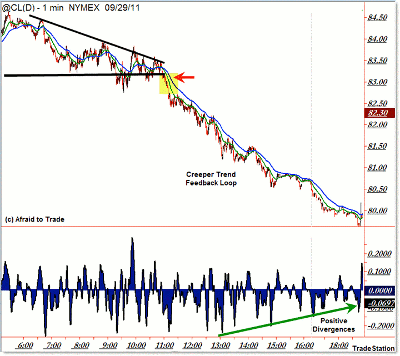
Our conversation begins when price triggers a sell short signal at 11:00 am CST with the break under the $83.00 support shelf.
What resulted was a bar-over-bar positive feedback loop that evolved into an infamous “creeper/oozing” trend that didn’t really give traders good entries, exits, or risk-management parameters.
That’s what a creeper trend does: it confuses many traders and leaves them sidelined, never quite getting that perfect retracement entry.
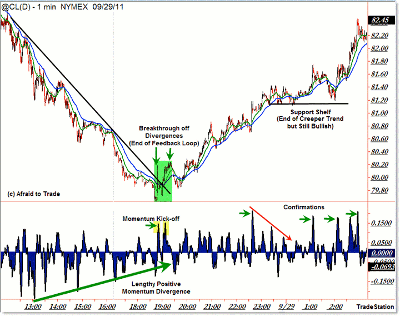
Let’s focus our attention on the overnight reversal off of lengthy (persistent) positive momentum divergences (3/10 oscillator) at the $80.00-per-barrel level.
In a trending move—including intraday creeper trends—we look mainly to EMAs to provide structure and trade entries on retracements.
We also look to these EMAs (I prefer the 20 and 50 periods) for reversal signals when price breaks through these averages.
We confirm the move by assessing the picture from momentum; namely, we want to see lengthy positive divergences ahead of a breakthrough.
We also want to see if the oscillator thrusts to a new relative high which accompanies the EMA (or trend line) breakthrough. If so, this is a hidden signal of strength; hidden because traders who are not assessing momentum do not see the “burst” or “kick-off” signal in the oscillator.
A momentum kick-off occurs when an oscillator thrusts to a new relative high (preferably off divergences) when price is clearly not making a new relative high.
Traders should not remain short after a kick-off signal that accompanies a price breakthrough of a trend line or EMA structure. In fact, this is an aggressive buy signal to play the potential trend reversal in development.
Traders place stops under the swing low when entering on the trend line/EMA breakthrough, in this case at $80.50.
NEXT: See This Trend Unfold on Shorter Time Frames
|pagebreak|An opposing or bullish feedback loop (“creeper trend”) developed to the upside, resulting in a similar bar-over-bar creeper/oozing price action until price developed a sideways support shelf around 6:00 am.
Unlike the prior session, price actually held this support shelf, resulting in a breakout “bull flag” buy signal…but that’s another story for another day.
For additional reference, here are the one-minute charts that step us inside both the down move and the up move:
Crude oil’s reversal signal and subsequent bullish “creeper trend” development:
Lower-time-frame charts provide a clearer picture of what we’re seeing on higher frames, allowing us to “step inside” the price action seen on a higher frame.
The important thing to learn from this reference post is the development/ignition of a creeper trend, the reversal signal via positive divergences, and the official trend reversal that created (surprise!) another creeper trend situation.
Take time to learn the lessons from clean examples like these so you’ll be better prepared to recognize and trade these situations when they develop in real time in the future (across all markets and time frames).
By Corey Rosenbloom, trader and blogger, AfraidToTrade.com
I’ll be speaking specifically on trend days—how to spot them in real time, how to trade them, when to expect them, and how to adapt your tactics/trades to them—at the upcoming Las Vegas Traders Expo in November.


